:quality(70)/cloudfront-us-east-1.images.arcpublishing.com/cmg/WC4XOA5FG4BNCIV66APUPXNQ5Q.jpg)
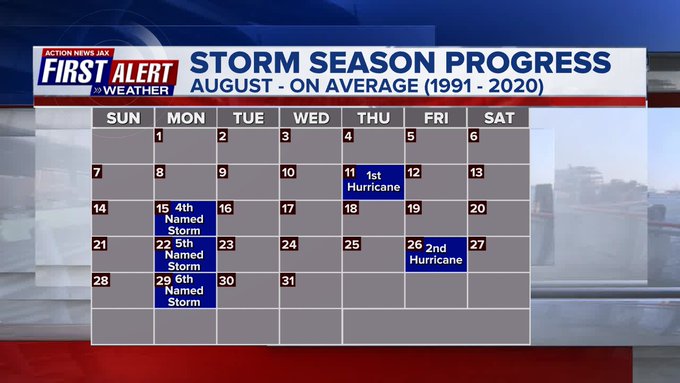
Jacksonville, FL — The “Buresh Blog” will next be updated the week of Aug. 15th but “Talking the Tropics With Mike” is updated every day through the hurricane season. The avg. date of the first Atlantic hurricane is Aug. 11th.
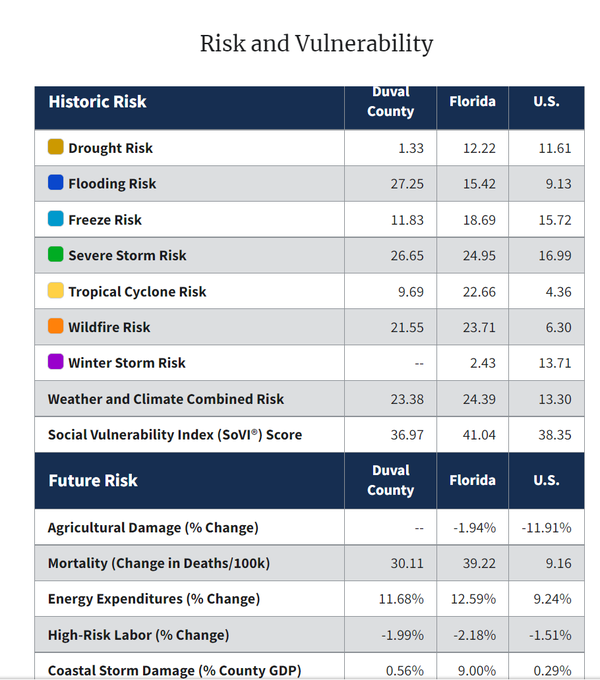
And in time for the peak of the hurricane season, NOAA has developed a new tool to assess vulnerability and risk down to county & community level - click * here * where you can use the interactive map.
The mapping tool now includes U.S. census tract data – providing many users with local community-level awareness of hazard risk, exposure and vulnerability across more than 100 combinations of weather and climate hazards.
The enhanced interactive maps from NOAA’s National Centers for Environmental Information (NCEI) cover all 50 states and the District of Columbia, and provide data for over 72,000 U.S. census tracts, which are small subdivisions of counties that average about 4,000 inhabitants. Users can now visualize a community’s combined physical exposure, socioeconomic vulnerability and markers of resilience to natural hazards on a finer scale than ever before.
So for Duval County:
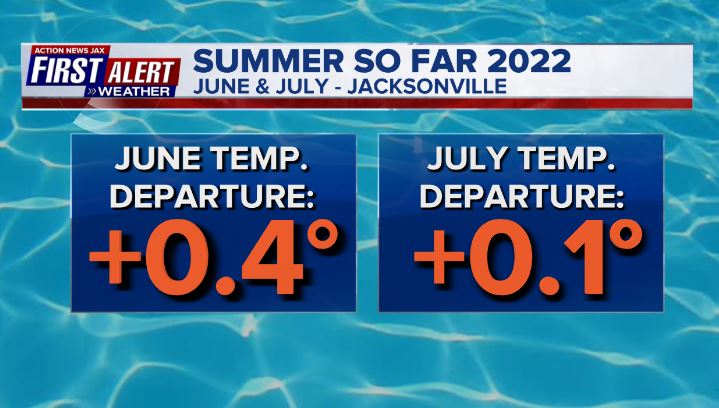
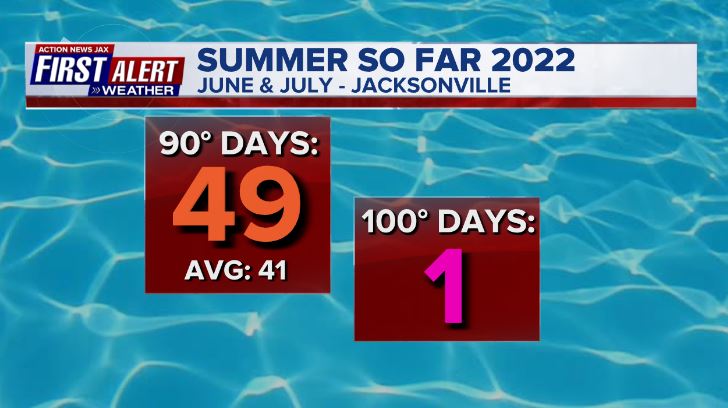
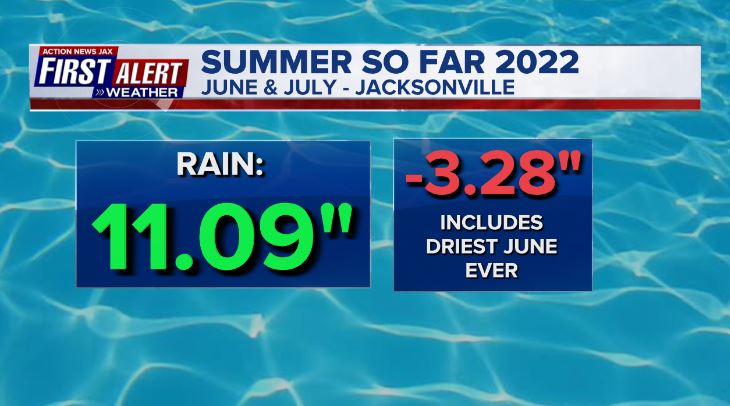
Some have felt the summer so far in Jacksonville has been unusually hot. But numbers show June & July statistically only slightly above avg. with rainfall below avg. thanks to a dry start. I’m thinking two things have been in play when it comes to the illusion that it’s been hot: (1) the record dry June which meant fewer cooling showers/storms & (2) the media crying out “it’s hotter than ever” & “millions of Americans under a heat advisory”, etc. The numbers for Jacksonville:
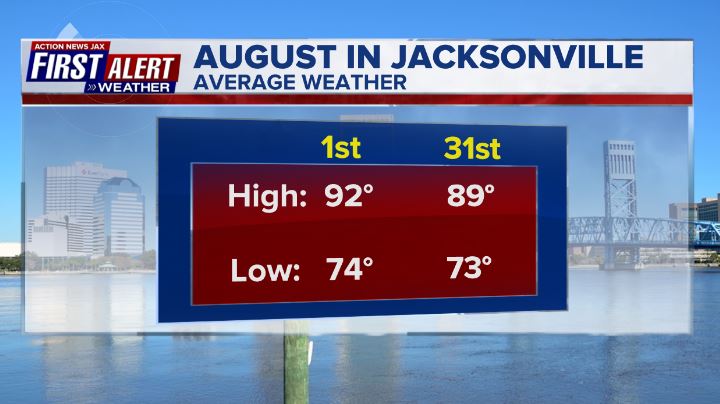
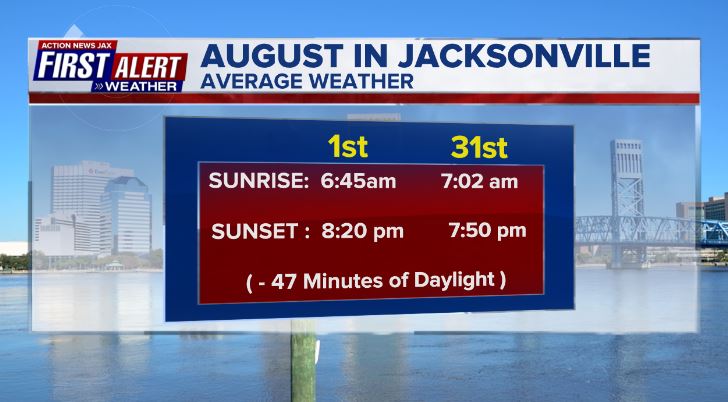
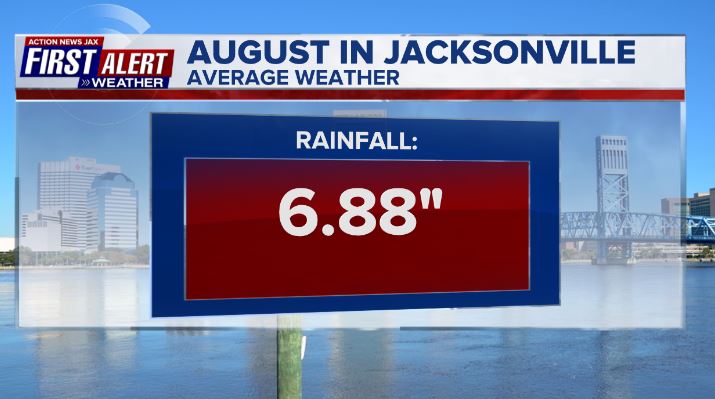
August averages for JIA:
The beginning of a solar max cycle (that started late in 2019/early 2020) is expected to peak (solar storms & sunspots) in 2025 - “Solar Cycle 25″ according to NOAA. Cycles are typically about 11 years (min to max & vice-versa). Some researchers feel the weather/climate is impacted but one aspect that’s more certain is technology on earth & satellites & astronauts in space. According to NOAA:
- Variable satellite drag due to atmospheric heating modifies spacecraft operations and orbits. This can cause satellites to reenter Earth’s atmosphere prematurely, decrease satellite lifetimes, increase the risk of orbital collisions, and cause spacecraft to be out of optimal position for their mission.
- Radiofrequency communication and navigation capabilities are degraded.
GPS positioning experiences errors due to the ionospheric disturbances (in plasma density) that occur on regional scales (a continent or larger).
Space-to-surface transmission noise is increased. This affects military monitoring of the north polar region and communications globally.
- During times of geomagnetic activity, the near-polar regions experience high fluxes of radiation in the form of energetic particles. These particles can travel to low altitudes, where they become a concern for airplane flight crew and passenger health.
- When intense electrical currents driven by space weather flow overhead in the I-T system, they can produce enormous “mirror” currents in power lines and pipelines. These currents can damage or destroy critical infrastructure, leading to expensive power outages or maintenance and repair costs.
![]()
April, 2014 - solar max - on the left, Dec., 2019 - solar min. - on the right (from NASA/SDO):

Oh-oh. The “Buresh Blog” turns a bit risque(!). So....From “LawnStarter”:
Love feeling the wind in your hair — and all over your body — while riding on two wheels? There are U.S. cities where that’s not only legal but also celebrated, so what are 2022′s Best Cities for Naked Biking? LawnStarter ranked the 200 biggest U.S. cities. How does Jacksonville stack up?
Jacksonville’s Rank in Some Key Metrics (1st = Best)
- Severity of Penalty for State Public Nudity Rule Violations - 176th
- Bike Shops per Square Mile - 173rd
- Biking-Related Fatalities per 100,000 Residents - 188th
- Historical Average Monthly Inches of Rain - 191st
To come up with our ranking, we first studied the regulatory landscape in each of the 200 biggest U.S. cities to help naked bikers avoid legal (and other) bumps on the road. We then considered the local popularity of naked biking, the size and activeness of the cycling community, and, of course, the climate. The full rankings are * here *.
For best biking *with* clothes on:

©2022 Cox Media Group
:quality(70)/d1hfln2sfez66z.cloudfront.net/04-25-2024/t_24132b8d08134f65ab5ac0a3ac2f17e7_name_file_960x540_1200_v3_1_.jpg)
:quality(70)/d1hfln2sfez66z.cloudfront.net/04-24-2024/t_d73855398dca4bf5a6e1eca4fedb0fdd_name_file_960x540_1200_v3_1_.jpg)
:quality(70)/cloudfront-us-east-1.images.arcpublishing.com/cmg/KH37NGBQ6ZCG3K7JGKOS22ZA7E.png)
:quality(70)/cloudfront-us-east-1.images.arcpublishing.com/cmg/NGMKLAKH5NF27JQOAGV7JN25OU.jpg)
:quality(70)/cloudfront-us-east-1.images.arcpublishing.com/cmg/UPSNZVHYKZE2VDSCN54C3FTF5E.png)