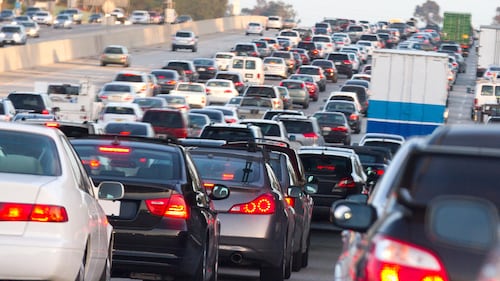
Best and worst drivers in the U.S. Think you've got the worst drivers in the country? A new study by LendingTree ranked the states' drivers from best to worst based on number of driving incidents.
Driving incidents are defined as accidents, DUIs, speeding-related incidents, and citations.
(Photos provided by Canva, Getty, Department of Transportation)
Best and worst drivers in the U.S. - 51. Michigan Michigan: 11.28 driving incidents per 1,000 residents
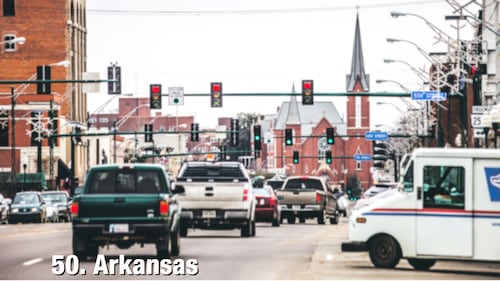
Best and worst drivers in the U.S. - 50. Arkansas Arkansas: 12.81 driving incidents per 1,000 residents
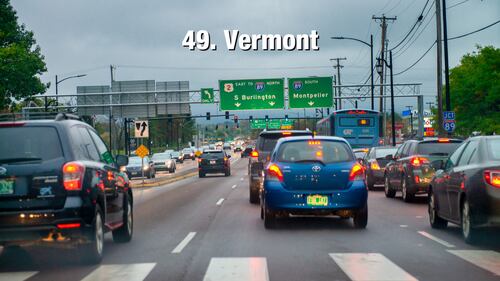
Best and worst drivers in the U.S. - 49. Vermont Vermont: 14.87 driving incidents per 1,000 residents
Best and worst drivers in the U.S. - 48. Kentucky Kentucky: 15.14 driving incidents per 1,000 residents
Best and worst drivers in the U.S. - 47. West Virginia West Virginia: 15.33 driving incidents per 1,000 residents
Best and worst drivers in the U.S. - 46. Oklahoma Oklahoma: 15.75 driving incidents per 1,000 residents
Best and worst drivers in the U.S. - 45. New York New York: 16.56 driving incidents per 1,000 residents
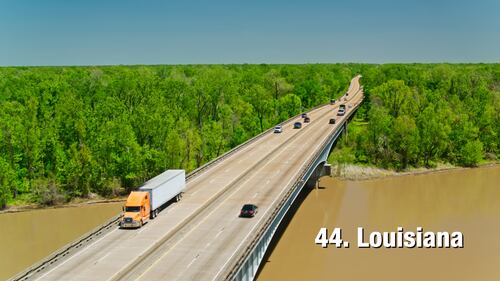
Best and worst drivers in the U.S. - 44. Louisiana Louisiana: driving incidents per 1,000 residents
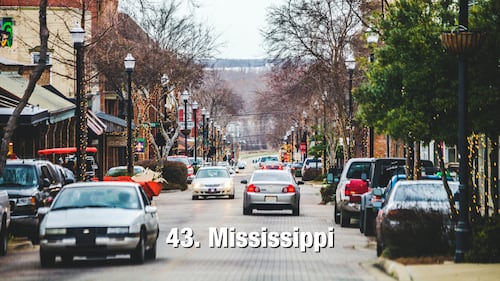
Best and worst drivers in the U.S. - 43. Mississippi Mississippi: 17.10 driving incidents per 1,000 residents
Best and worst drivers in the U.S. - 42. New Hampshire New Hampshire: 17.35 driving incidents per 1,000 residents
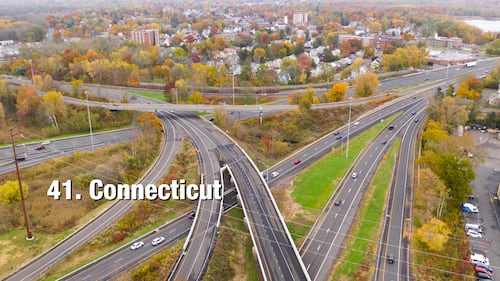
Best and worst drivers in the U.S. - 41. Connecticut Connecticut: 18.02 driving incidents per 1,000 residents
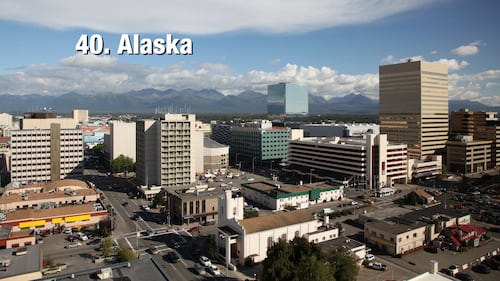
Best and worst drivers in the U.S. - 40. Alaska Alaska: 18.32 driving incidents per 1,000 residents
Best and worst drivers in the U.S. - 39. Nevada Nevada: 18.89 driving incidents per 1,000 residents
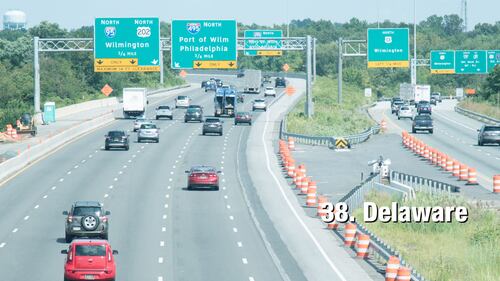
Best and worst drivers in the U.S. - 38. Delaware Delaware: 18.90 driving incidents per 1,000 residents
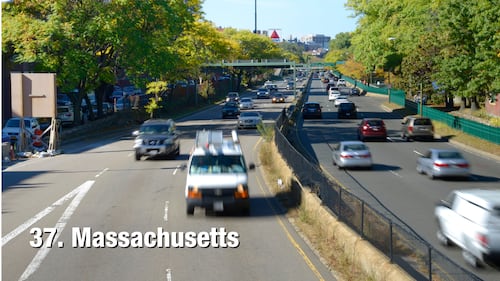
Best and worst drivers in the U.S. - 37. Massachusetts Massachusetts: 19.29 driving incidents per 1,000 residents
Best and worst drivers in the U.S. - 36. South Dakota South Dakota: 19.38 driving incidents per 1,000 residents
Best and worst drivers in the U.S. - 35. Pennsylvania Pennsylvania: 19.70 driving incidents per 1,000 residents
Best and worst drivers in the U.S. - 34. New Mexico New Mexico: 19.89 driving incidents per 1,000 residents
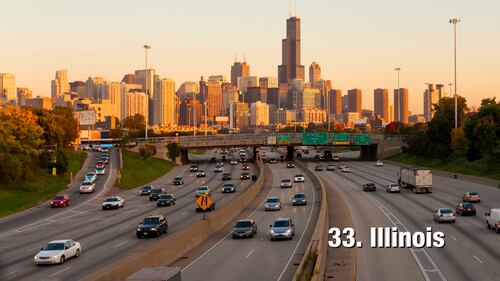
Best and worst drivers in the U.S. - 33. Illinois Illinois: 21.41 driving incidents per 1,000 residents
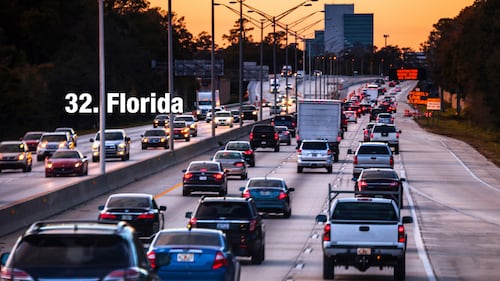
Best and worst drivers in the U.S. - 32. Florida Florida: 21.96 driving incidents per 1,000 residents
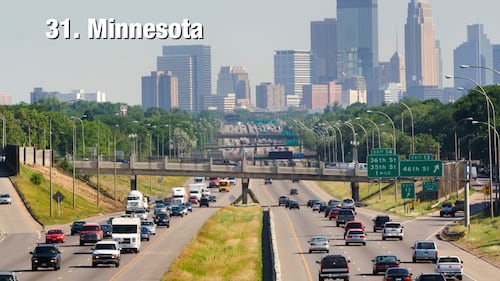
Best and worst drivers in the U.S. - 31. Minnesota Minnesota: 22.63 driving incidents per 1,000 residents
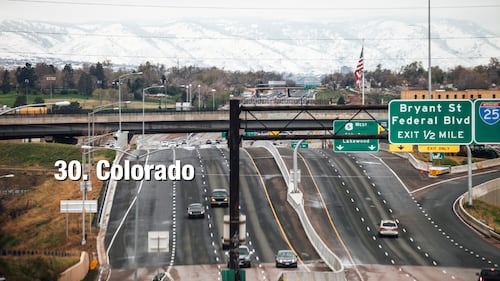
Best and worst drivers in the U.S. - 30. Colorado Colorado: 22.88 driving incidents per 1,000 residents
Best and worst drivers in the U.S. - 29. Kansas Kansas: 23.01 driving incidents per 1,000 residents
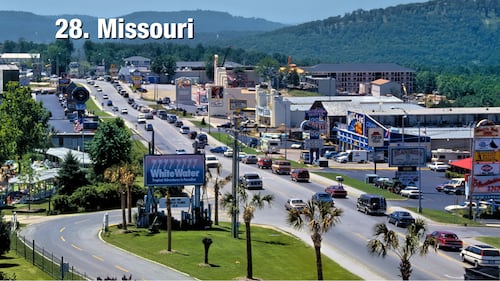
Best and worst drivers in the U.S. - 28. Missouri Missouri: 23.12 driving incidents per 1,000 residents
Best and worst drivers in the U.S. - 27. Arizona Arizona: 23.38 driving incidents per 1,000 residents
Best and worst drivers in the U.S. - 26. Alabama Alabama: 23.52 driving incidents per 1,000 residents
Best and worst drivers in the U.S. - 25. Wyoming Wyoming: 23.62 driving incidents per 1,000 residents
Best and worst drivers in the U.S. - 24. Iowa Iowa: 24.42 driving incidents per 1,000 residents
Best and worst drivers in the U.S. - 23. New Jersey New Jersey: 24.71 driving incidents per 1,000 residents
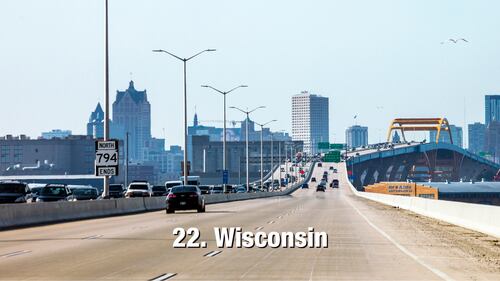
Best and worst drivers in the U.S. - 22. Wisconsin Wisconsin: 24.85 driving incidents per 1,000 residents
Best and worst drivers in the U.S. - 21. Tennessee Tennessee: 25.12 driving incidents per 1,000 residents
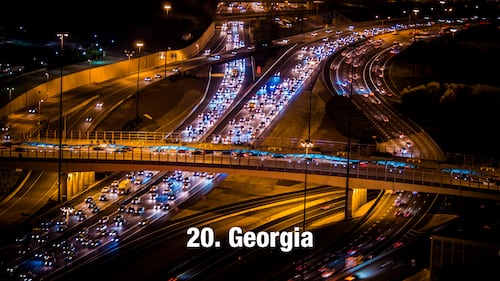
Best and worst drivers in the U.S. - 20. Georgia Georgia: 25.35 driving incidents per 1,000 residents
Best and worst drivers in the U.S. - 19. Texas Texas: 25.61 driving incidents per 1,000 residents
Best and worst drivers in the U.S. - 18. Nebraska Nebraska: 25.80 driving incidents per 1,000 residents
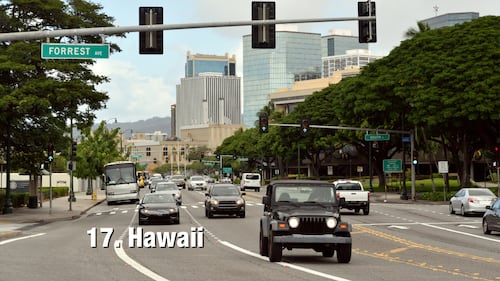
Best and worst drivers in the U.S. - 17. Hawaii Hawaii: 26.02 driving incidents per 1,000 residents
Best and worst drivers in the U.S. - 16. Idaho Idaho: 26.48 driving incidents per 1,000 residents
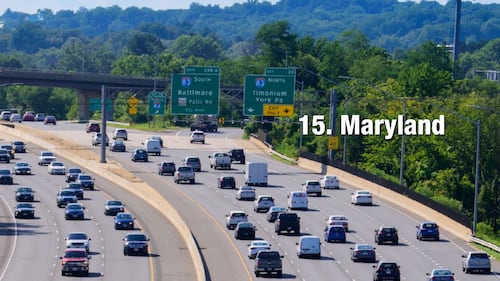
Best and worst drivers in the U.S. - 15. Maryland Maryland 27.07 driving incidents per 1,000 residents
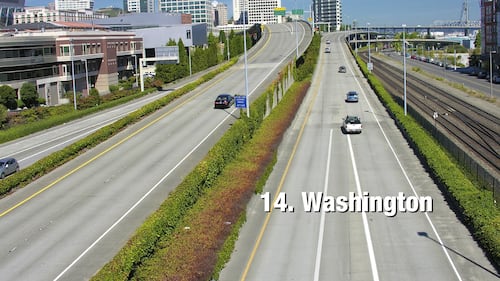
Best and worst drivers in the U.S. - 14. Washington Washington: 27.34 driving incidents per 1,000 residents
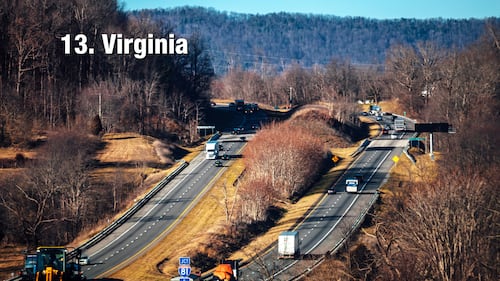
Best and worst drivers in the U.S. - 13. Virginia Virginia: 27.65 driving incidents per 1,000 residents
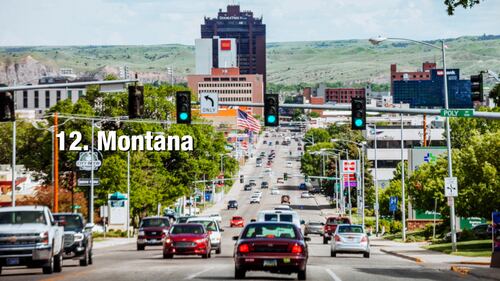
Best and worst drivers in the U.S. - 12. Montana Montana: 28.02 driving incidents per 1,000 residents
Best and worst drivers in the U.S. - 11. Oregon Oregon: 28.41 driving incidents per 1,000 residents
Best and worst drivers in the U.S. - 10. North Dakota North Dakota: 28.56 driving incidents per 1,000 residents
Best and worst drivers in the U.S. - 9. Ohio Ohio: 28.90 driving incidents per 1,000 residents
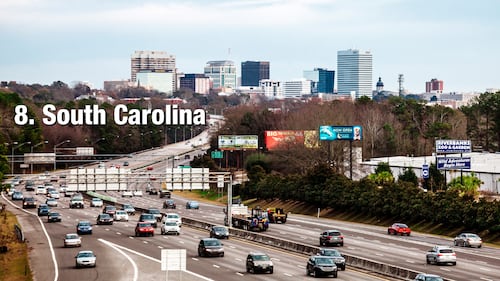
Best and worst drivers in the U.S. - 8. South Carolina South Carolina: 29.12 driving incidents per 1,000 residents
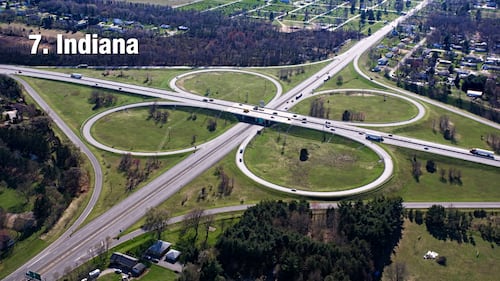
Best and worst drivers in the U.S. - 7. Indiana Indiana: 29.81 driving incidents per 1,000 residents
Best and worst drivers in the U.S. - 6. Utah Utah: 31.07 driving incidents per 1,000 residents
Best and worst drivers in the U.S. - 5. North Carolina North Carolina: 32.44 driving incidents per 1,000 residents
Best and worst drivers in the U.S. - 4. Washington D.C. Washington D.C.: 35.16 driving incidents per 1,000 residents
Best and worst drivers in the U.S. - 3. California California: 40.37 driving incidents per 1,000 residents
Best and worst drivers in the U.S. - 2. Maine Maine: 50.05 driving incidents per 1,000 residents
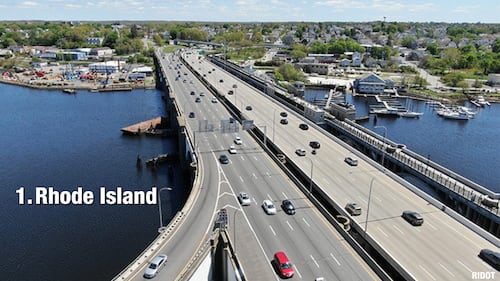
Best and worst drivers in the U.S. - 1. Rhode Island Rhode Island: 51.33 driving incidents per 1,000 residents