
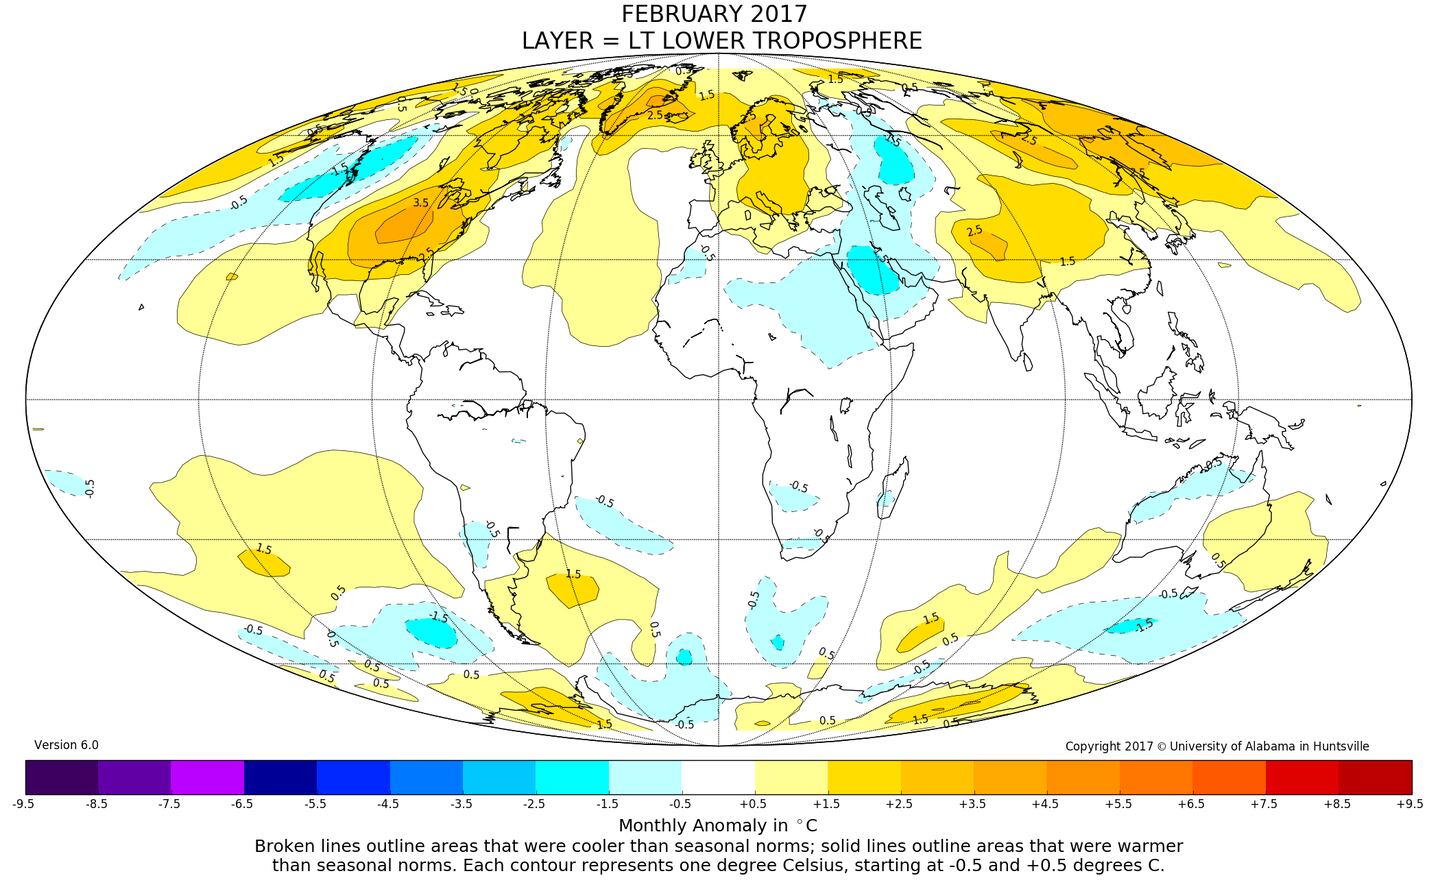
March 8, 2017 — The Feb. global temp. numbers are in & temps. were again above avg. with a peak (vs. avg.) over the U.S. centered on Missouri.
As part of an ongoing joint project between UAH, NOAA and NASA, Christy and Dr. Roy Spencer, an ESSC principal scientist, use data gathered by advanced microwave sounding units on NOAA and NASA satellites to get accurate temperature readings for almost all regions of the Earth. This includes remote desert, ocean and rain forest areas where reliable climate data are not otherwise available.
The satellite-based instruments measure the temperature of the atmosphere from the surface up to an altitude of about eight kilometers above sea level.
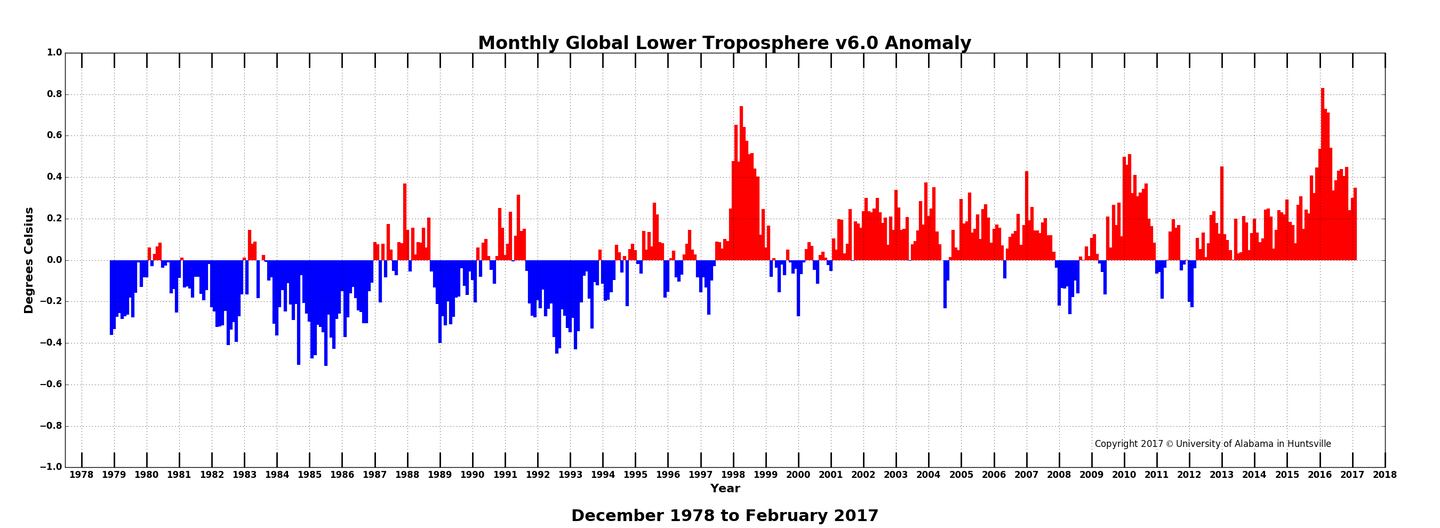
Global climate trend since Nov. 16, 1978: +0.12 C per decade
February temperatures (preliminary)
Global composite temp.: +0.35 C (about 0.63 degrees Fahrenheit) above 30-year average for February.
Northern Hemisphere: +0.54 C (about 0.97 degrees Fahrenheit) above 30-year average for February.
Southern Hemisphere: +0.15 C (about 0.27 degrees Fahrenheit) above 30-year average for February.
Tropics: +0.05 C (about 0.09 degrees Fahrenheit) above 30-year average for February.
January temperatures (revised):
Global Composite: +0.30 C above 30-year average
Northern Hemisphere: +0.27 C above 30-year average
Southern Hemisphere: +0.33 C above 30-year average
Tropics: +0.07 C above 30-year average
(All temperature anomalies are based on a 30-year average (1981-2010) for the month reported.)
Notes on data released March 2, 2017:
The 2015-16 El Niño Pacific Ocean warming event has faded into history, but the globe still saw its fourth warmest February in the satellite global temperature record, including the warmest February in that time for the contiguous 48 U.S. states, according to Dr. John Christy, director of the Earth System Science Center at The University of Alabama in Huntsville. The average temperature over the U.S. was 2.1 Celsius (about 3.78 degrees Fahrenheit) warmer than seasonal norms in February 2017.
February anomalies
U.S. 48 contiguous states
1. 2017 +2.10 C
2. 1991 +1.69 C
3. 2003 +1.58 C
4. 2001 +1.32 C
5. 1998 +1.12 C
6. 1997 +0.80 C
7. 1985 +0.62 C
8. 2007 +0.61 C
9. 1994 +0.52 C
10. 2008 +0.46 C
Compared to seasonal norms, the warmest spot on the globe in February was over Warrensburg, Missouri, with an average temperature that was 4.06 C (about 7.31 degrees Fahrenheit) warmer than seasonal norms.
Compared to seasonal norms, the coolest average temperature on Earth in February was near the town of Penny in central British Columbia, Canada. February temperatures there averaged 2.51 C (about 4.52 degrees F) cooler than seasonal norms.
2017 Accumulated Cyclone Energy [ACE]
| Basin | Current YTD | Normal YTD | % of Normal YTD | Yearly Climo* | 2016 ** |
|---|---|---|---|---|---|
| Northern Hemisphere | 0 | 4 | 0% | 568 | 604 |
| Western N Pacific | 0 | 3 | 0% | 302 | 263 |
| Eastern + Cent N Pac | 0 | 0 | % | 138 | 189 |
| North Atlantic | 0 | 0 | % | 104 | 138 |
| North Indian | 0 | 0 | % | 18 | 14 |
| Southern Hemisphere + | 38.8025 | 144 | 26% | 209 | 208 |
| Global | 34.6425 | 111 | 31% | 771 | 800 |
MARCH SKIES:
SkyandTelescope.com for more information.
Easy sky measures: Hold out your arm. Your smallest finger appears about 1° wide, and your clenched fist is 10° wide.
Mar. 4 (night): The Moon occults (covers) Aldebaran for the contiguous U.S.
Mar. 10 (night): The waxing gibbous Moon hangs 2–4° below or lower left of Regulus, the brightest star in Leo.
Mar. 12: Daylight-saving time starts at 2 a.m. (local time) for most of the United States and Canada.
Mar. 14 (night): Jupiter, Spica, and the waning gibbous Moon form a triangle after rising in the east around 9 or 10 p.m.
Mar. 19 (dusk): About 30 minutes after sunset, Mercury and Venus are about 8½° (one fist) apart and 5° up in west.
Mar. 20 (morning): Approximately 3° separate the last-quarter Moon and Saturn. The pair will be highest at dawn.
Mar. 20: Spring begins in the Northern Hemisphere at the equinox, 6:29 a.m. EDT (3:29 a.m. PDT). Sun rises due east and sets due west everywhere in U.S.
Mar. 22 (dusk): With clear horizons, look for Venus low in the west after sunset — then low in the east before sunrise.
Mar. 29 (dusk): As twilight deepens, the thin waxing crescent Moon sinks low in the west. About 30–45 minutes after sunset, look for 1.5-magnitude Mars about 10° above it.
Mar. 30 (dusk): The Moon is about 8° left or upper left of Mars.
Moon Phases
First Quarter Mar. 4, 7:32 a.m. EST
Full Moon Mar. 12, 10:54 a.m. EDT (Worm Moon)
Last Quarter Mar. 20, 11:58 a.m. EDT
New Moon Mar. 27, 10:57 p.m. EDT
Spring forward into energy efficiency, Sarah Blount.......
For most of the people living in the United States (excluding many of the US territories, Hawai’i, and residents of Arizona outside of the Navajo Nation), Sunday, March 12, will mark the start of Daylight Saving Time (DST). You’ve probably heard the mnemonic “spring forward, fall back,” and hopefully you’ll remember to reset your clocks, but do you know why we have this adjusted summer schedule?
Due to the tilt in earth’s axis, summer days have more hours of sunlight than do the days in winter. As the sun creeps up over the horizon earlier and earlier in the day, we end up with lots of sun in the early morning hours when much of the population is still asleep. The idea of DST is to shift the clocks an hour earlier, so that the extra daylight instead occurs at the end of the day, when people are awake and out and about, avoiding “wasted daylight” in the wee hours of the morning.
In the United States, DST was originally adopted near the end of World War I in an effort to conserve fuel domestically and repurpose these resources for the war effort. By shifting the clocks earlier, people would have daylight to illuminate their after-work activities, reducing the need for electrical lighting and thus decreasing their fuel consumption.
Daylight Saving Time fell out of use after the war, but was again taken up and then subsequently dropped over the course of World War II. It wasn’t until 1966 that DST legislation was passed without being attached to a war, and today we observe this adjusted schedule from the second Sunday in March through the first Sunday in November. Across the world, more than 70 countries also change the clocks during their summer months, and in Europe this period is called “Summer Time.”
As we prepare to “spring forward,” take this opportunity to look around your home at your lighting. Daylight Saving Time was designed with the goal of saving energy on illumination, so it’s a good reminder to see if there are ways that your lights can be more energy efficient. Are you using traditional incandescent bulbs around your home? By switching to an ENERGY STAR certified bulb, you could realize energy savings of 70-90%, saving you between $30 and $80 in electricity costs over the bulb’s lifetime. Learn more about energy-efficient lighting and determine what kind of lighting is best for your home.
Sources:
- Alridch, Bob. 2015. "Saving Time, Saving Energy: Daylight Saving Time: Its History and Why We Use It." California Energy Commission. Accessed October 22.
- ENERGY STAR. 2015. "Lighting: ENERGY STAR Tools and Tips for Home Lighting." Accessed October 22.
- Kotchen, Matthew J., and Laura E. Grant. 2008. "Does Daylight Saving Time Save Energy? Evidence form a Natural Experiment in Indiana." NBER Working Paper 14429, National Bureau of Economic Research, Cambridge, MA.
- Matulka, Rebecca. 2014. "Top 8 Things You Didn't Know About Daylight Saving Time." US Department of Energy. Accessed October 22, 2015.

Cox Media Group


