
JACKSONVILLE, Fla. — To become a part of the First Alert Neighborhood weather station network powered by Tempest - scan below &/or click * here *:
Yet another freeze - now up to 23 this season in what has been a long winter by Jacksonville standards. The first freezes were in early November & the last will most likely be March 18th. The latest freeze on record in Jacksonville is April 8th (2007). The average for a season is 14 freezes (32 degrees F or lower) with the average last freeze date Feb. 25th for Jacksonville.


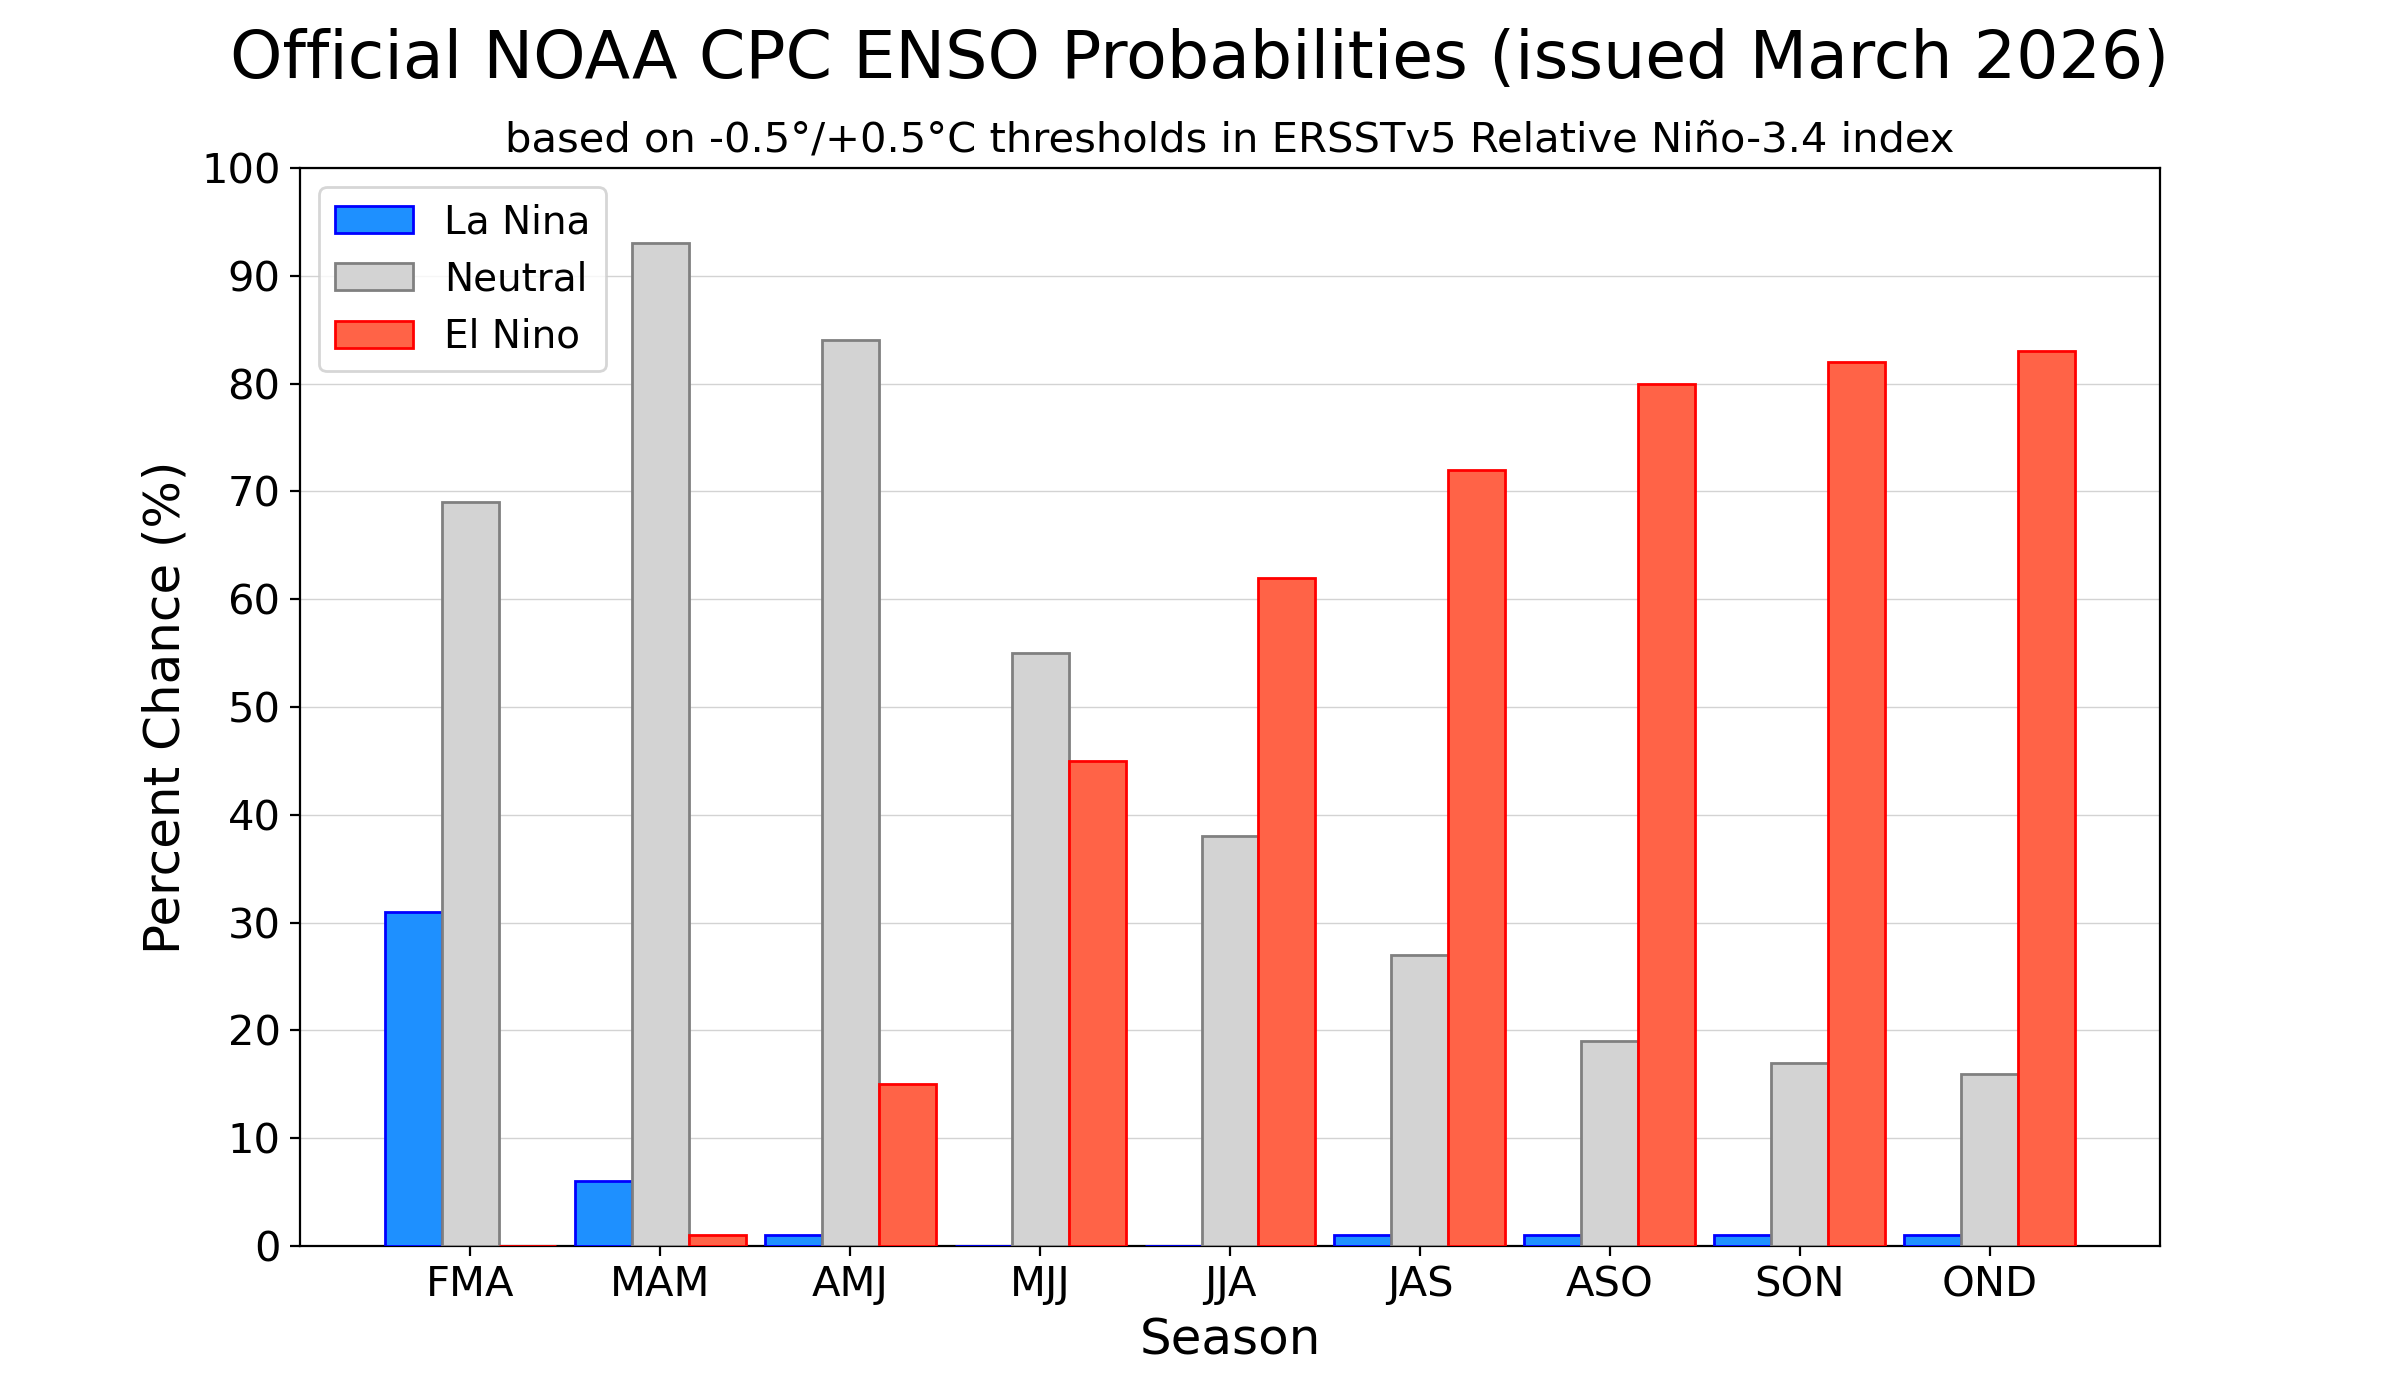
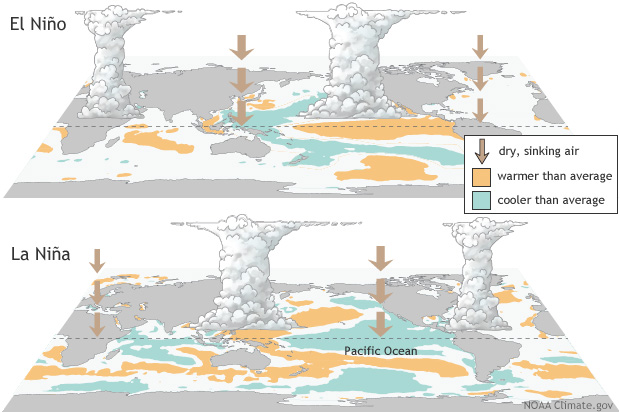
NOAA has issued an El Nino watch as the La Nina is quickly collapsing. The La Nina (cooling of the equatorial Pacific water) has been pretty weak overall but signs are pointing to a potentially strong El Nino (warming of the equatorial Pacific). Shifts in the ENSO (El Nino-Southern Oscillation) can impact weather & the marine environment worldwide. Most importantly for Jacksonville/NE Fl. & SE Ga. - there is *usually* a lower number of tropical cyclones across the Atlantic Basin.
Sea surface temps. at the moment show a generally neutral pattern either way to the Pacific equator though does appear to be a bit of a La Nina hangover (some cooler water) while there is some very warm water near the coast of S. America:


Forecast models predict the El Nino to gain steam through the northern hemisphere summer & continue well into autumn:
The National Hurricane Center has announced some changes to their forecast products during the upcoming season with the most notable change being enhancements to the forecast cone.
NHC will implement a new version of the cone graphic that includes a depiction of all land-based (coastal and inland) tropical storm and hurricane watches and warnings in effect for the continental United States, Hawaii, Puerto Rico, and the U.S. Virgin Islands. This version of the cone graphic went through an experimental phase during the 2024 and 2025 hurricane seasons and replaces the version that only depicted coastal U.S. tropical storm and hurricane watches and warnings. User feedback showed strong support for the addition of inland watches and warnings. In addition, recommendations from social science research suggest that the addition of inland watches and warnings to the cone graphic helps communicate wind risk during tropical cyclone events while not overcomplicating the graphic with too many data layers. Note that the legend on the new version of the cone includes symbology for areas where a hurricane watch and tropical storm warning are simultaneously in effect (diagonal pink and blue lines), and there is one shading for the entire 5-day cone.

The First Alert Weather Team has been addressing confusion about the forecast cone for many years & especially since 2016 & 2017 when hurricanes Matthew & Irma approached Florida with narrow forecast cones (high confidence forecast) leading to some folks interpreting the cone as indicating they were out of danger. So with that in mind, I decided to either take the cone off the graphics or - more commonly - to overlay the wind, rainfall & flood forecast. The examples below show the forecast wind field vs. the very narrow forecast cone for hurricane Helene & the second image is the rainfall forecast vs. the narrow forecast cone for hurricane Milton (both in 2024). The Atlantic hurricane season is from June 1 through Nov. 30, & I will once again update “Talking the Tropics With Mike” every day throughout the hurricane season.


