Sept. 9, 2019 — Daily updates on the tropics throughout the hurricane season: "Talking the Tropics With Mike".
Well.... here we are - within a week of hurricane Dorian's closest approach to Jacksonville/NE Fl./SE Ga.
I'll try to organize my thoughts, forecast process & the public's reaction below.
First & foremost.... my personal thoughts, feelings & prayers to the Northern Bahamas - so hard hit by Dorian. The most evil of possible hurricane hits was unleashed on the islands. The utter destruction is something to behold & difficult to comprehend.
Let me be clear. Challenging my predictions & what I said & what I forecast is certainly fair game. I've gone over my forecast & messaging time & time again. But if one is going to do this, then you have to examine MY forecast.
And the decision when we - as a station (CBS47/Fox30) - go with enhanced then wall to wall coverage of a weather event is not something that our management takes lightly. In the end, such a decision costs us much more money than we can earn in such a format. And realize I'd much rather have my feet kicked up relaxing &/or spending time at home with my family than be at work 18-20 hours a day for days on end.
So.... Dorian was born from a tropical wave off the coast of Africa late in August - pretty classic for the time of the year.

The stair-step track to the W/NW is typical of a late summer track of tropical cyclones from the deep tropics. The big question mark in the track of the hurricane was the position & strength of the Bermuda High + a weak upper level trough near the Mid Atlantic & New England.

The question marks became especially apparent Mon., Sept. 2nd. I walked into the daily afternoon news meeting declaring "I was not worried about this wave until this morning. We now have to carefully watch this disturbance". I had already sent out an email to managers in the morning - a full 9 days before the closest approach to NE Fl./SE Ga. My "call" at this point was a landfall at/near Cape Canaveral - something I stuck with for 7 days. Reality was a hurricane 50 miles to the east of the Cape.
On the same day... one of the local t.v. "forecasters" issued their "forecast" (was brought to my attention)... & went so far as to cut off the cone at Florida! That was followed up by a graphic that showed the storm proceeding west across far S. Fl. with the implication being that there would be no impacts further north. I'll continue to hit on how hanging out with a single model is remarkably dangerous & misleading. Based on that forecast alone... there was no danger to NE Fl./SE Ga. or any areas farther north. That borders on irresponsible.
I was dealing with forecasts that had our own news room & our viewers/listeners hanging on to every NHC forecast. When the 5pm Dorian advisory was issued Fri., Aug. 30th, all hell broke out. This was the advisory that had a Cat. 2 hurricane near the WGF by mid week (Sept. 4th). At 5pm.... my credo was "stay calm, don't panic". By 11pm of the same day, my emphasis was on "this forecast will change". I tweeted the graphic below on Fri., Aug. 30th:

On the same day - Fri., Aug. 30th - I posted this tweet:
#firstalertwx great quick conversation while walking my dog, Opie - neighbor: hey Mike, is that storm gonna’ hit us? Me: we’ll get a lot of rain next week.N’bor: what about wind? Me: some but not real severe. N’bor: so we don’t need to go all crazy?? Me: that’s exactly right! 🙂 pic.twitter.com/BoBxmR97VV
— Mike Buresh (@MikeFirstAlert) August 30, 2019
I received mixed reaction on Twitter & my Facebook Fan Page. But my point needed to be focused on the last two lines: Neighbor: "So we don't need to go all crazy?". Me: "that's exactly right!"
The combination of the NHC forecast putting a hurricane near Jacksonville the next week followed by Dorian becoming one of the most intense hurricanes on record over the Atlantic Basin made for a toxic mix of forecasts & nerves among the public.
One of my major faults during this time was me not realizing the public perception despite my own forecasts. I fell victim to thinking everyone was watching/listening/reading my forecasts. Admittedly - big time ignorance on my part. This would come back to haunt me throughout the week .... &, in fact, to this day.
On Mon., Sept. 2nd I decided to post the following message on my FB personal page:
"Here ya' go friends. It's my nerdy ("weather-y") look at Dorian that's usually posted on my professional page. But what'll happen with Dorian locally is very near the top of the manifesto

:). We'll get through this just fine. Do some preparing & stay cool, calm & collected. Sun will shine & the temps. will be hot again by Thu./Fri. & the weekend. Click:
Take care ......"
On Fri., Aug. 30th, hurricane research aircraft + the frequent (every 6 hours) release of N.W.S. weather balloons (soundings) across the S.E. United States was ingested by the forecast models (00Z/8pm EDT). This often results - in my opinion & experience - an over correction by the models. This time was no exception as the models shifted abruptly to the east - way to the east. When this happens, it's common for a "re-correction" closer to where the models were previously. And so this began model "mayhem" & a wide array of forecasts/observations & predictions.
On Sat., Aug. 31 I attempted to emphasize the shift of the models to the east & the overall uncertainty:
#firstalertwx Dorian tracks shifts east: https://t.co/0L8OvYLan3 - "Talking the Tropics With Mike" - additional changes/updates in the track sure to come @WOKVNews pic.twitter.com/g2ze3JlzGj
— Mike Buresh (@MikeFirstAlert) August 31, 2019
Within 48-60 hours, Dorian became the monster Cat. 5 hurricane that was only matched by the 1935 Labor Day hurricane that raked the Florida Keys as the most intense Atlantic hurricane to make landfall. It was only the 2nd Cat. 5 to hit any part of the Bahamas (Andrew, 1992). It was at this juncture that the public seemed to take notice & so began the upheaval of emotions, preparation & anxiety.

Hurricane hunter aircraft during Cat. 4 penetration the morning of Sept. 1st - stadium effect (imagine sitting in a football stadium & looking down at the field) within the eye:


Sunday afternoon, Sept. 1st - evacuation orders were issued by some local (NE Fl.) counties resulting in a cascading effect of evacuations, school cancellations & business closings. By late in the day Labor Day, the First Coast was essentially shut down regardless of any changes in the forecast. At this point, our coast was within 48 hours of impacts which - by definition - is decision time. I tweeted late in the afteroon: "don't really know what to say. Remarkable but incredibly sad for the Bahamas":


Loop below from GOES-16 satellite courtesy CIMSS:

The cone & forecast below is from 11pm Sunday evening, Sept. 1st. Reality ended up being pretty darn close. The closest approach to the First Coast was about 2pm approximately 100 miles east of Jax Beach.
I often used the term "beach beating" when talking about impacts only to realize that some viewers thought I meant even structures would be wiped out when I was really talking about the geography of our coast line.


Dorian stalled over Grand Bahama Island Sun. night into Monday, Sept. 1-2 which was "necessary" to begin the northwest then north turn. Unfortunate for the Northern Bahamas, but this would end up being the key to keeping the hurricane east of Florida. I tweeted shortly after 2am Mon., Sept. 2:
#firstalertwx 2am advisory update Mon., 09/02 - raging Cat. 5 continue to crawl & "scrape" across Grand Bahama Island... appears to have near stalled in latest satellite imagery which would imply start of NW then north move(!) @WOKVNews pic.twitter.com/DQyYVSRB8O
— Mike Buresh (@MikeFirstAlert) September 2, 2019
Remarkable tweet/photos from Hopetown, Bahamas from Jim Edds, "Extreme Storms" (pressure in the eye at 911mb/26.90" of mercury!:


The extreme intensity of Dorian did correlate with very warm deep oceanic heat content. Sea surface temps. are important but even more critical is the amount of deep ocean heat that's available. The red shading shows very warm ocean water well below the surface of the sea.

By late Mon., Sept. 2nd the cone had shifted east where it basically stayed through Wed. Good forecast model agreement made the forecast for the eye relatively certain but the width of winds to the west of the eye would be the key to any NE Fl. impacts. Remember that the west side of a hurricane (where our coast would reside) is the weakest with the radius of winds not as large vs. to the east side of the hurricane.
In "Talking the Tropics With Mike" late on Mon., Sept. 2nd, my forecast was as follows:
* Coastal winds will steadily increase through midweek - Tue.: 15-30 mph with gusts to 40 mph...
Wed.: 30-50 mph with gusts to 60 mph before rapidly diminishing late Thu.
Winds near the I-95 corridor will increase to 10-20 mph Tue. with gusts to 30 mph... & to 20-30 mph with gusts to 40 mph Wed.
Winds near & west of Highway 301 will not be essentially non-factor averaging 10-20 mph with gusts to 30 mph.

Adding confidence to my forecast was the ol' W. Pacific teleconnection though this set-up did not present itself until Mon., Sept. 2nd. Typhoon Lingling was moving just about due north near the coast of China with upper level high pressure to the east essentially mirroring the set-up over the W. Atlantic with Dorian & the Bermuda high.

I like to be able to communicate impacts by comparing the forecast with past storms. It turns out that Dorian was a compromise between Matthew, 2016 & Floyd, 1999. In the end, Matthew was about twice as close as Dorian - 40 miles - & Floyd was about twice (200 miles) as far away. It's notable that the greatest U.S. evacuation in peacetime history was ordered in 1999 as Floyd approached. Due to a more narrow cone of uncertainty - more accurate track forecasts - such a massive evacuation was not ordered for Dorian.

Essentially Dorian's closest approach to the NE Fl./SE Ga. coast Wed., Sept. 4th:

The heaviest/strongest rain bands mostly stayed just offshore.... literally by 10-20 miles. Had these rain bands made it ashore, winds would have been much stronger than those observed. Perfectly forecasting such a narrow difference between a lot of wind & less wind just simply isn't possible..... & never will be. Officials did what they had to do to insure public safety on a forecast that was well within enough "average error" to require at least some evacuation orders.

Storm surge/wind damage to a dock along the St. Johns River:

Crescent Beach Wed., Sept. 4th:

Amelia Island Wed., Sept. 4th vs. Thu., Sept. 5th:


Note the before & after images below at Summer Haven in St. Johns Co., Fl. showing a cut/breach similar to what happened during Matthew in 2016.


Abaco Islands damage in the Northern Bahamas. Dorian was the first Cat. 5 to hit any of the Bahamas since Andrew in 1992 & appears to have tied with the Labor Day hurricane of 1935 (Fl. Keys) for the most intense Atlantic hurricane to make a landfall. We've had a bit of a "slew" of Cat. 5's recently including Matthew in 2016.... Irma & Maria in 2017..... Michael in 2018 & now Dorian this year. Prior to 2016 there had only been two Cat. 5's since 2006 (Dean & Felix in 2007 into Central America). History of U.S Cat. 5 hits * here *.


FORECAST & THE MODELS
Well.... the track forecast & even the timing of Dorian's movement was painful to say the least. Early on - nearly 10 days prior to the closest approach to Fl. - virtually all models showed the tropical wave staying weak & therefore being steered west/northwest all the way into the Gulf of Mexico with little or no development. By Sun./Mon., Aug. 23rd-24th, some of the forecast models - the European in particular - started to show a tropical cyclone farther to the north &, thereby threatening Florida. The GFS model did not follow suit until Tue., Aug. 25th. The UKMET (United Kingdom) model was quite literally all over the place & did not really "catch on" until the following weekend! (Aug. 31/Sept. 1). Few of the models accurately depicted intensity until very late in the "game". Once the hurricane was east of Florida, most of the models showed too wide - & too strong - of a wind field on the west side of the hurricane. A common mistake by forecast models but what is also counter-intuitive. Lots of closet weather folks gave the wind values by these models at our coast way too much validity. Some also kept fixated on the HWRF model which was showing a strong hurricane moving northwest across E. Central then N. Central Fl. It's my experience that the HWRF & NAM models simply should not be used for tropical forecasting.
From Mon., Aug. 24th through Wed., Aug. 26th, many models showed Dorian moving near & southwest of Puerto Rico then over Hispaniola. Such a track usually ends up being the demise of tropical cyclones due to the mountainous terrain of Haiti & the Dominican Republic. But reality late in the week was a move hundreds of miles to the east & north of Puerto Rico resulting in only minor impacts on Puerto Rico & allowing for slow but steady intensification since there was no land interaction.
By the weekend - Aug. 31/Sept. 1st - Dorian had become a "major" Cat. 3 hurricane then a Cat. 4 after a rapid intensification (RI) cycle Fri. into Sat. followed by yet another RI late in the weekend taking Dorian to Cat. 5.
Forecast models showed a slowing trend but none of the models stalled the hurricane. The GFS model below shows the 3pm Wed. forecast while the 2nd image shows the European "spray" at about the same time. Several days earlier, the European showed a hurricane cutting just about due west across S. Florida. So before just jumping on the European bandwagon, realize the model was far from perfect. It's why the best forecasts often take into account other model solutions (consensus forecast). We had a local t.v. forecaster that so bit on this solution that it was felt it would be best to "cut off" the cone which - at the time - extended as far north as the Fl./Ga. border - & then to draw an arrow due west implying no threat to the north. Astonishing decision considering the end result. There was another t.v. guy that essentially totally blew off the wave early on.
Now.... my forecast was not perfect, but I point out these other forecasts to accentuate the caution that's needed when trying to predict the tropics, especially when the steering currents are far from well established.
The fourth image below shows the spaghetti plots on Aug. 29th which were just way too far south in the end.


Aug. 29th:

The chart below is the 500mb (~30,000 ft.) forecast from the GFS for Sun., 09/01 & ended up being pretty decent. The main "players" are clearly on the field - Bermuda high over the Western Atlantic a bit west of Bermuda & at about Norfolk, Virginia's latitude + a trough moving into New England. The result was the "soft spot" near the east coast - the alleyway that became Dorian's path near & along the U.S. east coast.

COMMUNICATING THE FORECAST MESSAGE
The problem with the public knowing what we forecast & what we did not is that most viewers/listeners no longer focus/rely on a single source/weather station for their forecast & therefore their decision-making. So we're faced with all of "us" being lumped together in what was - or was not - predicted. It's a reality of today's world. So much "noise" constantly interfering with our ability - at least sometimes - to come to reasonable conclusions & solutions regarding whatever "impending doom" might be headed our way.
While forecast models & our practical knowledge of weather are far better than ever, forecasting impacts from a hurricane that might be 30 vs. 50 vs. 70 vs. 100 miles offshore is exceedingly difficult & means the difference of winds by as much as 50+ mph.
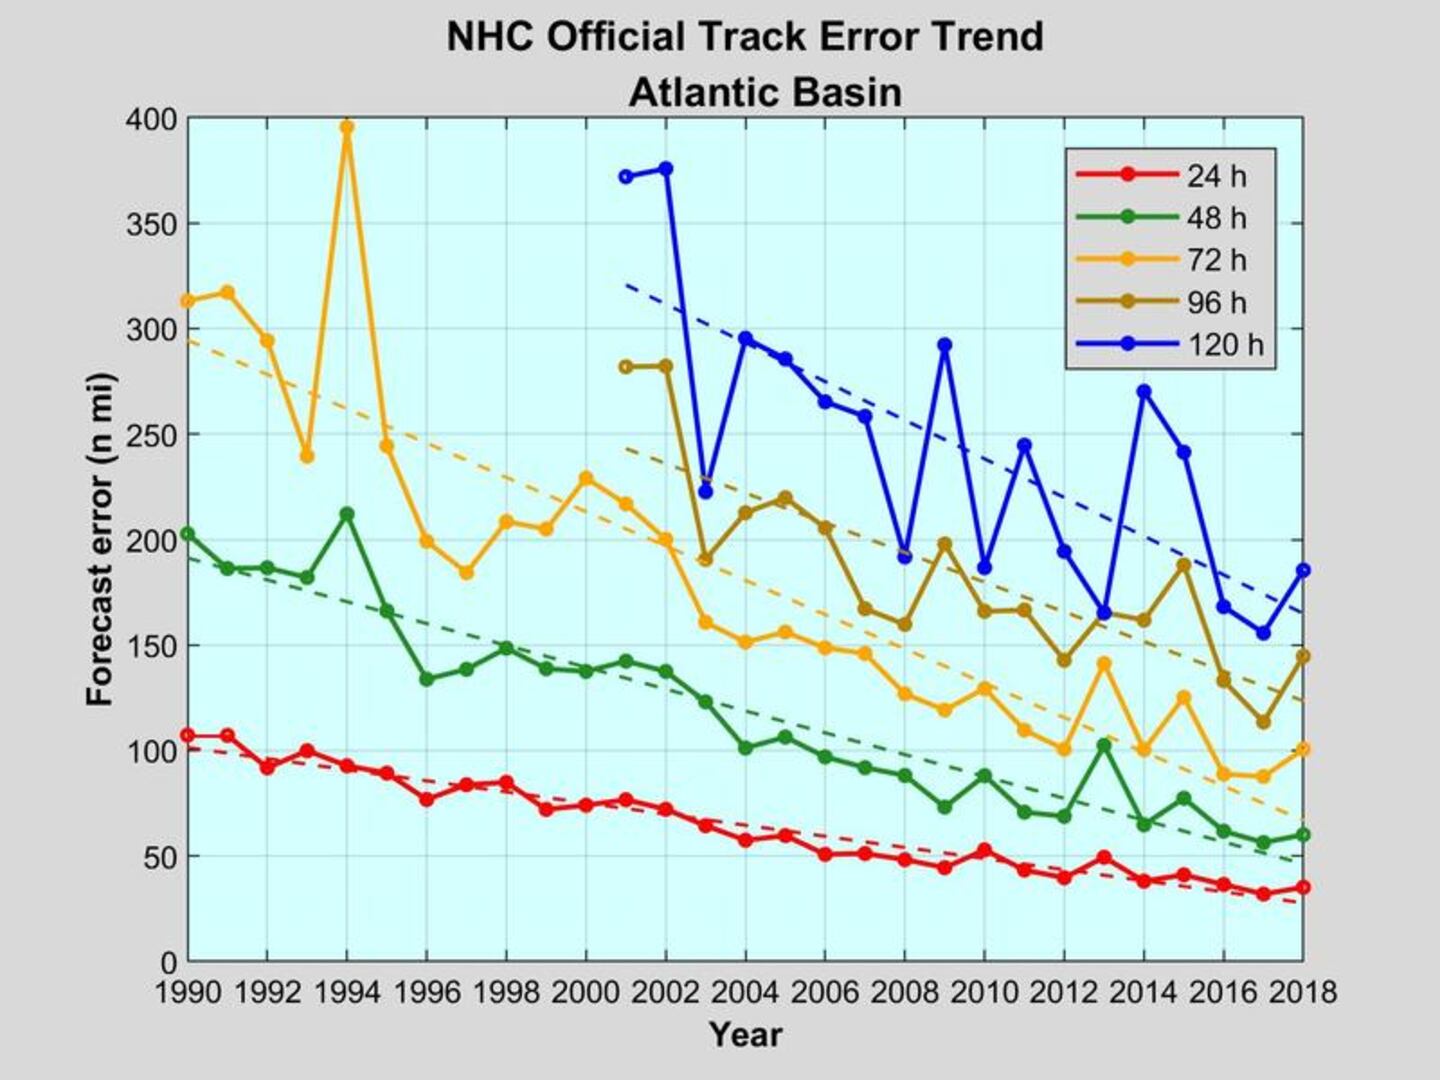
The graph below shows the NHC avg. forecast error ranging from 24 hours to 5 days. While the improvement is obvious, the avg. error at 120 hours is still near 200 miles.
And why is it still so difficult to make a precise forecast & when will meteorologists be able to issue perfect forecasts?
(1) chaos - the atmosphere is in constant flux & acts like a fluid but, of course, is not bottled up by any kind of container. One has to take into account all levels of the atmosphere & try to forecast any changes in all those levels to issue a forecast. Not to mention the constant variable of change & distance when taking into account a forecast. In simplest terms:
Chaos theory is a part of mathematics. It looks at certain systems that are very sensitive. A very small change may make the system behave completely differently. ... Some systems (like weather) might appear random at first look, but chaos theory says that these kinds of systems or patterns may not be.
It really comes down to the ol' "butterfly effect":
The flapping of a butterfly's wings can cause a hurricane on the other side of the world. While this may not generally be the case, it's a good example of the butterfly effect, or the idea that tiny changes in complex systems can cause huge effects.
(2) the second part of the above question - when will meteorologists be able to issue a perfect forecast: never.
Air flows from high to low pressure & is constantly compensating. It's like the old adage "what goes up, must come down". And so our weather patterns are intricately interwoven on a global scale.

Ultimately.... I believe the answer to dealing with big weather disasters comes down to mitigation. Logical preparation, advance planning & better building codes in addition to sensible civic planning should all play a role.
Dorian by the numbers (preliminary info., "records/notable facts" from Phil Klotzbach):
-185 mph lifetime maximum sustained winds–tied with Gilbert (1988) and Wilma (2005) for the 2nd strongest maximum sustained winds in the Atlantic basin since 1950. Allen (1980) had maximum sustained winds of 190 mph.
-185 mph maximum sustained winds by Dorian were the strongest on record by any hurricane in the Atlantic basin outside of the tropics (>23.5°N) -910hPa lifetime minimum central pressure –tied for 9th lowest pressure (Hurricane Ivan-2004 also had 910 hPa lifetime minimum central pressure) in the Atlantic basin since 1980.Note: Pressure records are not consistently reported in the Atlantic hurricane database prior to 1980.
-48 Accumulated Cyclone Energy (ACE)units generated –the 5th most for a named storm forming in August in the satellite era (since 1966). -48 ACE –more than 14 full Atlantic hurricane seasons since 1950: 1962, 1968, 1970, 1972, 1977, 1982, 1983, 1986, 1987, 1991, 1993, 1994, 1997 and 2013.
-14 named storm days –tied with Felix(1995) for 3rd place for most named storm days by a storm forming in August in the satellite era (since 1966).
-10 hurricane days –tied for 6th place (with Emmy in 1976 and Frances in 2004) by a storm forming in August in the satellite era (since 1966).
-4.5 major (Category 3+) hurricane days –tied for 7th place (with David in 1979) by a storm forming in August in the satellite era (since 1966).
Landfall Records-Abaco Island: 185 mph, 911 hPa –Category 5-Strongest hurricane on record to make landfall in the Bahamas (by pressure)-Strongest hurricane on record to make landfall on Abaco Island
-Tied with Dorian's landfall intensity on Grand Bahama for strongest hurricane on record to make landfall in the Bahamas by maximum sustained wind-Grand Bahama: 185 mph, 914hPa–Category 5
-Tied with Dorian's landfall on Abaco for strongest hurricane on record to make landfall in the Bahamas (based on maximum sustained wind) -First Category 5 hurricane on record to make landfall on Grand Bahama Island
-North Carolina: 90 mph, 956hPa–Category 1- 18th hurricane since 1950 to make landfall in North Carolina (including Hazel in 1954 which made landfall on NC/SC border)
-Same exact maximum wind speed (90 mph) and minimum central pressure (956 hPa) as Florence in 2018
-Landfalling central pressure of 956 hPa ties for 6th lowest central pressure (with Floyd in 1999 and Florence in 2018) for a landfalling North Carolina hurricane since 1950.
Translation Speed Records - Dorian tracked only ~25 miles in 24 hours –the 2nd shortest straight-line distance tracked by an Atlantic major hurricane in a 24-hour period since 1950 (trailing only Hurricane Betsy in 1965 which tracked only ~12 miles in a straight-line distance in a 24-hour period).
Local Dorian numbers:


The photo below is the First Alert Weather team "in action" Wed., Sept. 4th early in the afternoon. I'm very proud of the team & especially proud of the consistent messaging without being alarming. One of our better forecasts was that "we are not forecasting sustained winds to reach tropical storm force inland" which meant the inland & downtown bridges would not be closed. This proved to be accurate. Our rainfall was forecast was generally too high though not far off the 2-5" along the coast.... 1-2" near I-95... & less than an inch well inland near/west of Highway 301.


Cox Media Group


