
Sept. 29, 2016 — "Tracking the Tropics With Mike" updated every day here ......
We turn the calendars to Oct. & we finally start to usually feel more sustained breaks from the heat & humidity. The averages for JIA:
Low / High...... 1st: 66 / 84..... 31st: 55 / 77
Sunrise / Sunset..... 1st: 7:20am / 7:11pm..... 31st: 7:41am / 6:39pm - lose 53 min. of daylight
Rainfall: 3.93"
So we end our "wet season" (June/July/Aug./Sept.) dry - especially along the I-95 corridor to the beaches. JIA had jus 59% of the avg. rainfall over that 4 month period at just under 16". The map below - courtesy NASA/GSFC, IMERG global precipitiation dataset - shows the rainfall extremes across the U.S. from May through Aug. Note the green shading over NE Fl./SE Ga. indicating the drier than avg. conditions.....
Eight states in center of the country had a top-ten wettest summer... too much for farmers at times!
Louisiana experienced historic flooding near Baton Rouge.
South Carolina, and Massachusetts had top-ten driest summers with extreme drought in Eastern Mass. Boston had its driest summer in the last 134 years.
Extreme drought conditions continue for parts of California.

Which brings me to 90 degree days.... we avg. only 1 90-degree day in Oct., so we should be just about done with what has been a long, hot summer. So far JIA has officially had 97 90-degree days which is above the avg. of 82 days but well short of the record of 114 days in 2011. Most notable was the 30 days of 90+ in July though all 31 days have been 90+ in the past (1875, 1992 & 1993). The breakdown with reality this year vs. avg. of 90 degree days/month
April: 1 / 1
May: 6 / 8
June: 21 / 17
July: 30 / 24
Aug.: 27 / 21
Sept.: 12 / 10
Total: 97 / 82
Meanwhile.... Hurricane "Joaquin" was born this week a year ago on Sept. 27th, 2015. The infamous storm will be remembered for the sinking of the El Faro (it was later determined that the ship's captain was using old forecast info. [at least 24 hours old] for "Joaquin" which likely proved to be fatal since "Joaquin" was so rapidly intensifying while also shifting south & west) & the tropical cyclone's forecasting headaches. The tropical depression on the 27th became a tropical storm on the 28th... the El Faro left port in Jacksonville on the 29th... "Joaquin" became a hurricane on the 30th going through a rapid intensification cycle whereby it became a Cat. 3+ later in the day in less than 24 hours... the El Faro was sunk near the Bahamas on Oct. 1 when "Joaquin" was a Cat. 4... peak intensity -- close to Cat. 5 -- was on Oct. 2 as "Joaquin" moved northeast away from the battered Bahamas.
Below I've reprinted my "Buresh Blog" & Tracking the Tropics With Mike" info. on "Joaquin" from the first week of Oct., 2015:
A quick review: "Joaquin" went hurricane early Wednesday undergoing a rapid intensification cycle that saw the storm go from a tropical storm to Cat. 3 in a little more than 24 hours then to a Cat. 4 early Thu. afternoon. The hurricane briefly dropped to a Cat. 3 Friday afternoon - early Sat. before going through yet another "growth spurt" Saturday taking the violent hurricane to near Cat. 5 status as hurricane hunter aircraft found winds near 155 mph & falling pressure. That peak intensity did not last long & there has been a steady weakening since due to cooler water temps. & increasing shear. The tropical cyclone passed Bermuda to the west as Cat. 2 dropping to Cat. 1 in the process. Dry air is being drawn into the storm by the strong circulation with much of the more intense convection over the northern & northeast part of the circulation, but the hurricane has remained remarkably well intact north & northeast of Bermuda.
The sometimes more reliable European model in the past was an outlier to the west -- far to the west -- on "Joaquin". So the European model wins this forecast battle, hands down. The European model was one of the first models to take an intense hurricane initially southwest & deep into the Bahamas -- where it went. Most of the hurricane forecast models -- HWRF & GFDL -- hooked the hurricane rather abruptly west/northwest into the U.S. The problem is these models have bordered on being horrible the past few years.... & certainly this season. In fact, the NAM (North American Model) -- which is a mesoscale (small) scale model not necessarily intended for tropical cyclones but has been tweaked on & off the last few years to try to do better on "in-close" tropical cyclones -- was shutting down last week during its forecast cycle unable to finish the job. One of theories put forth by modelers is that the NAM was not handling the environment well (namely anomalously warm water) near "Joaquin". Will be an interesting offseason for tropical cyclone numerical modelers - time to get busy!
"Thanks" to national & even some local media outlets, it has to be pointed out that THERE HAVE NOT BEEN & WILL NOT BE DIRECT U.S. IMPACTS FROM "JOAQUIN". But there will still be some very rough & dangerous weather for areas from Eastern Ga. through the Carolina's to near Chesapeake Bay where there has been flooding, gusty winds, very rough seas & surf & a high rip current risk. But these weather elements were a combination of a stalled front & the strong upper level disturbance vs. a any kind of hurricane input. It's true there have been some added surface winds courtesy the pressure gradient between hurricane "Joaquin" & high pressure to the north, but the tropical cyclone's circulation was way, way, way, way to the east.
It's likely that "Joaquin" will remembered for several outstanding "traits", & I would think the name will probably be retired late winter/early spring (the annual list of names returns every 6 years). For blow by blow details with regards to forecasting "Joaquin" last week, you can check "Talking the Tropics With Mike".
(1) the forecast model mayhem
(2) the first Oct. Cat. 4 hurricane to directly hit the Bahamas since 1866
(3) the sinking of the large cargo ship - El Faro. There have been a lot of questions regarding why El Faro ventured into an intensifying hurricane. It's possible there was not much the captain could do because of mechanical failure, but it will be up to a future investigation to determine if mechanical difficulty was indeed the beginning of the end for the ship. Initial forecasts certainly were of little value BUT rapidly changed & were updated such that the crew would have had more than enough time to steer clear of the mighty storm. Below you'll find a series of track/intensity forecasts + satellite images:
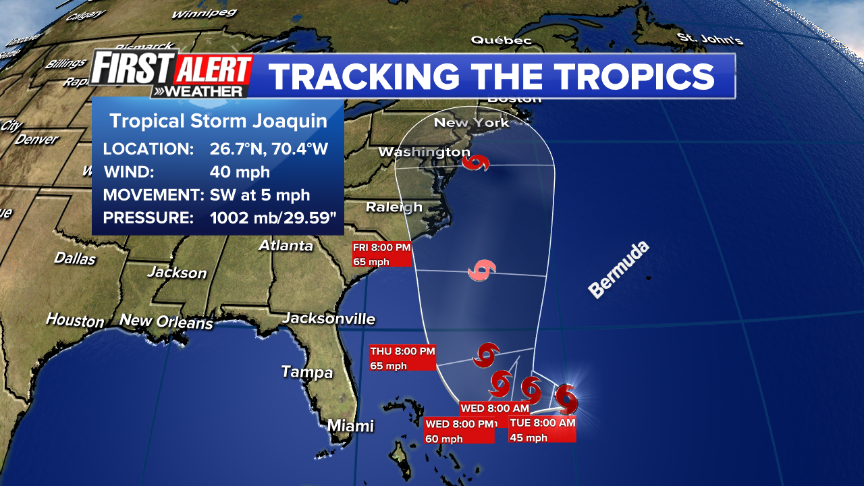
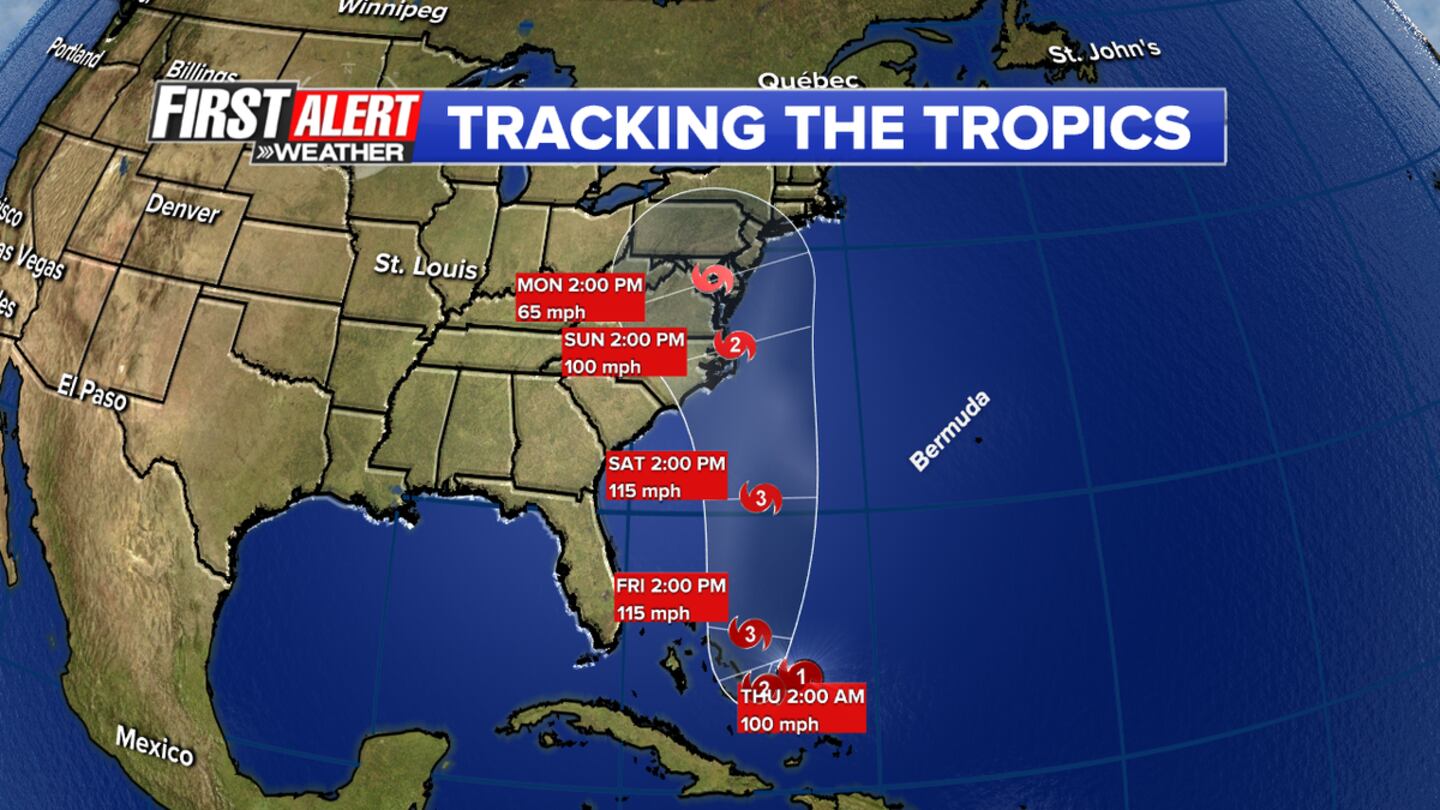
The forecast below was from early Tue. - about when El Faro left port from Jacksonville. Looking at this forecast, the captain would have little to be concerned about if simply taken for face value.
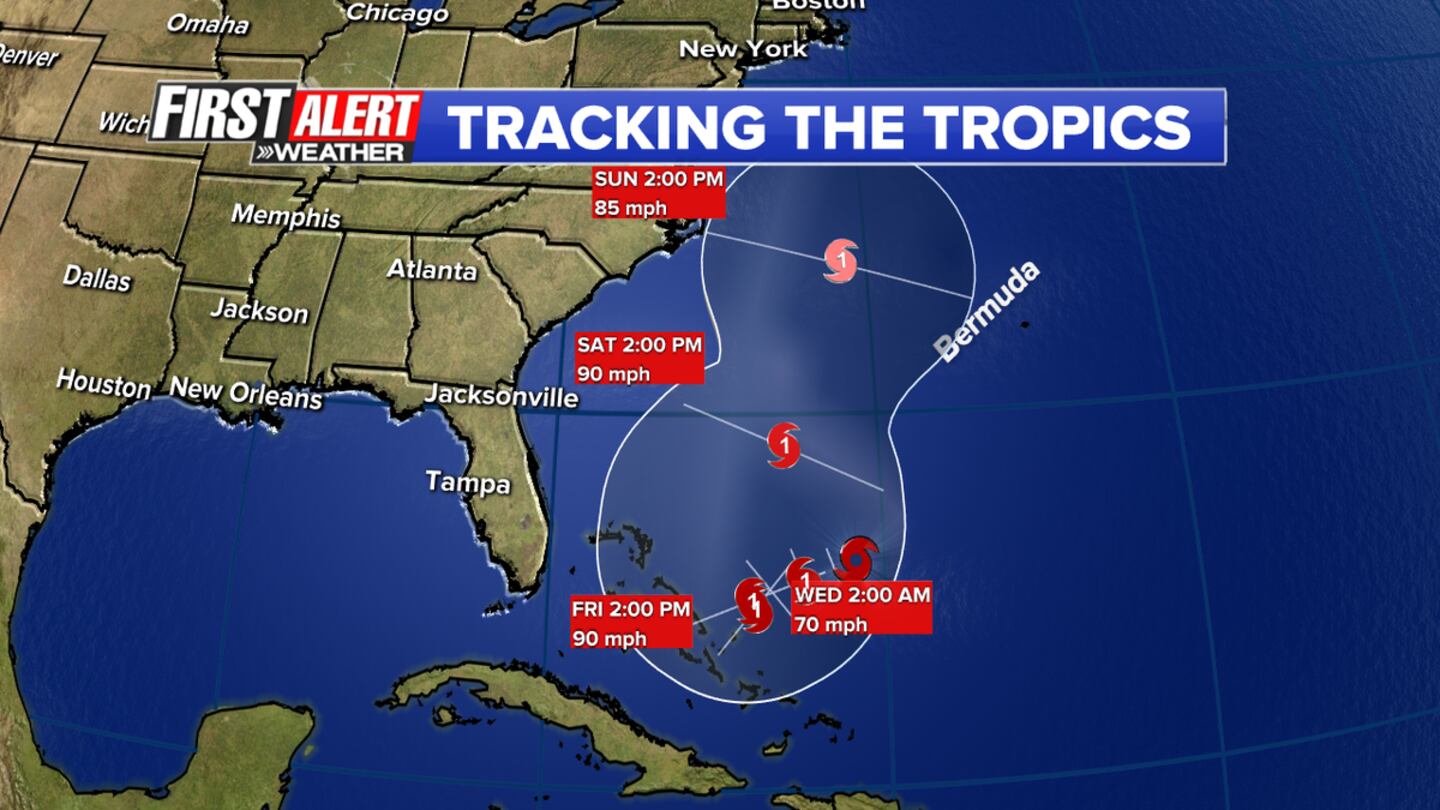
But the forecast changed drastically in just 12 hours. Below is the forecast from Tue. evening -- a hurricane dipping more southwest toward the Bahamas. Crooked Island (where El Faro disappeared) is in the "cone of uncertainty" as is most of the Bahamas.
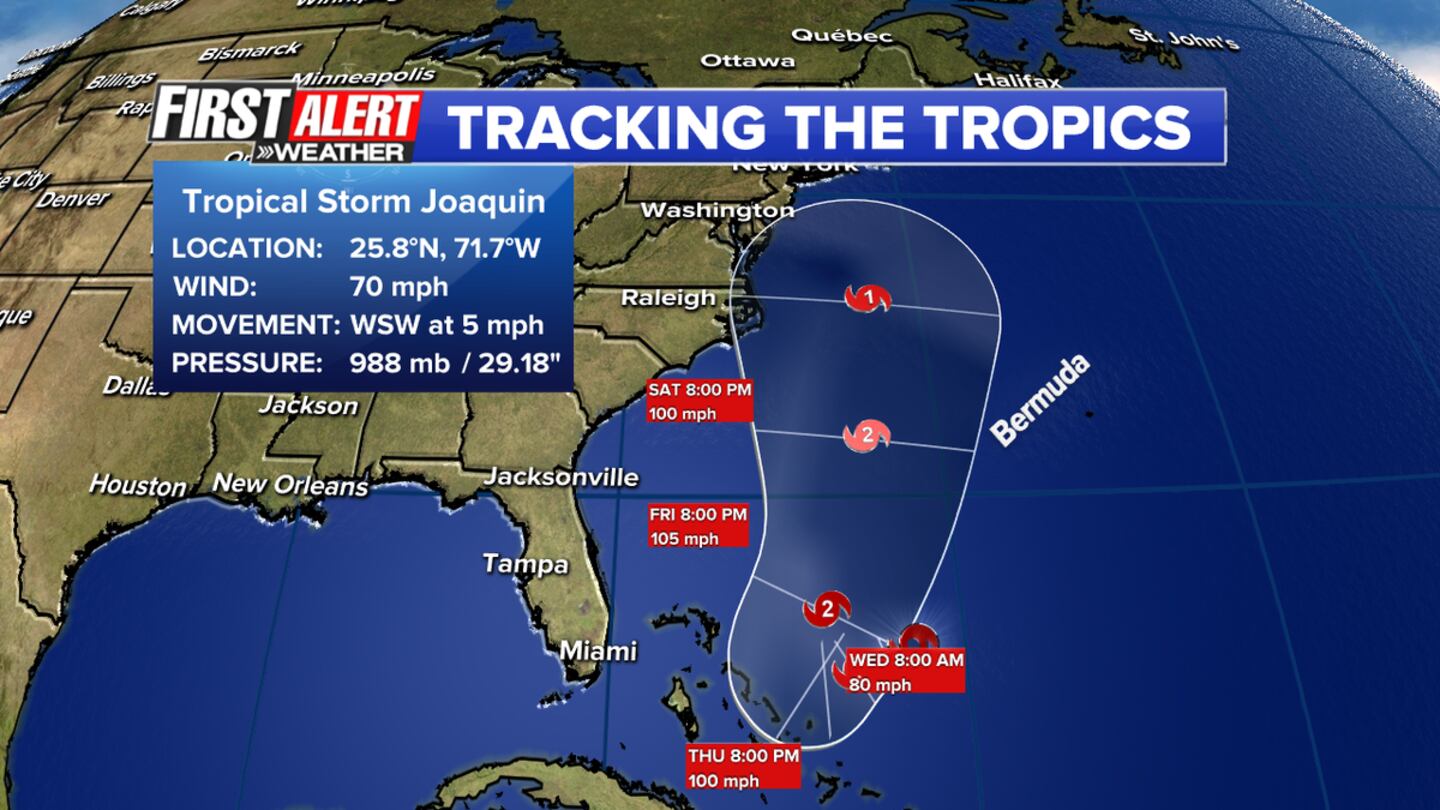
The early Wed. forecast takes "Joaquin" to Cat. 2.... BUT still not far enough southwest. In fact, there's been a slight adjustment to the east.
Late Wednesday (a forecast a bit farther southwest)......
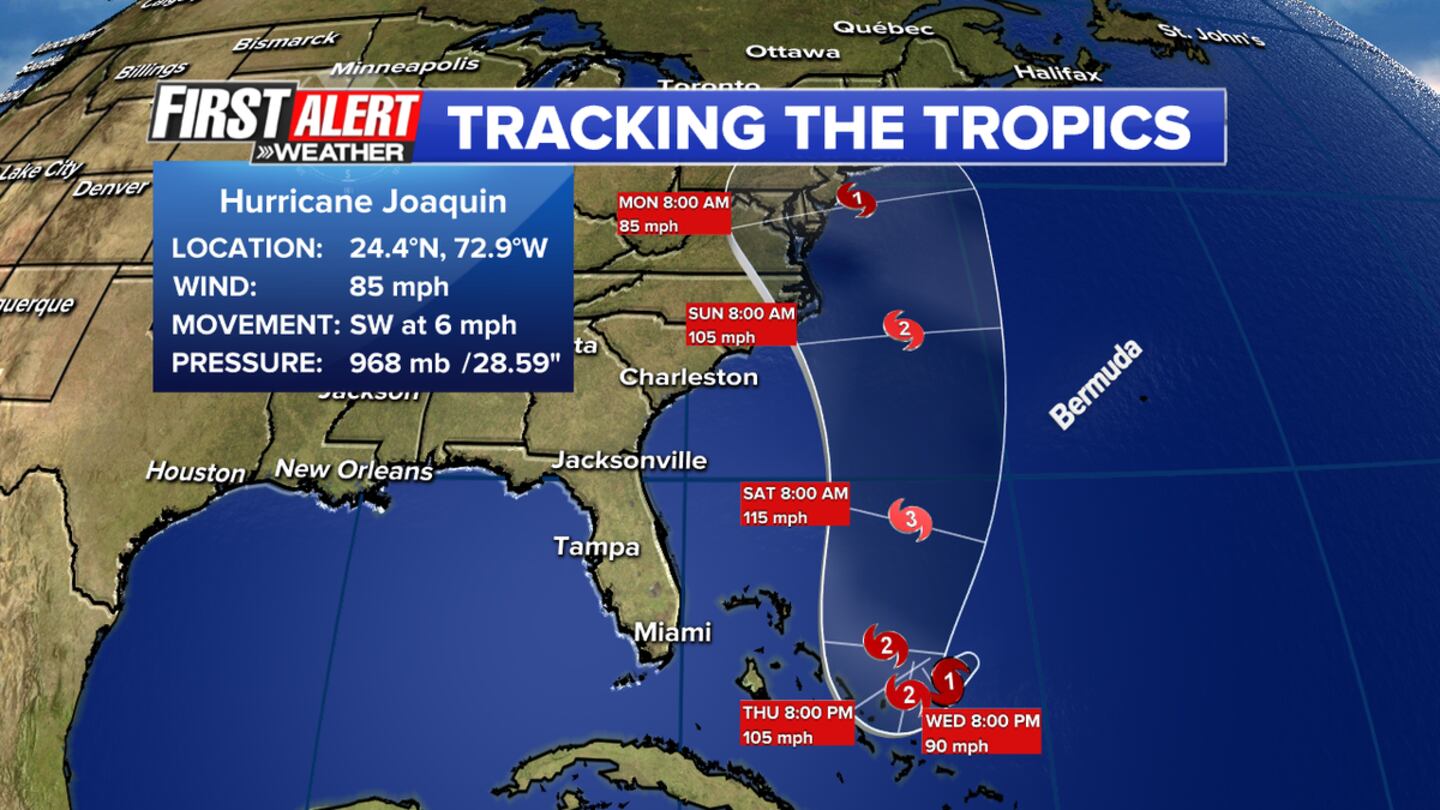
Late Wed. evening.... taking the storm to Cat. 3 + closer to the Bahamas......
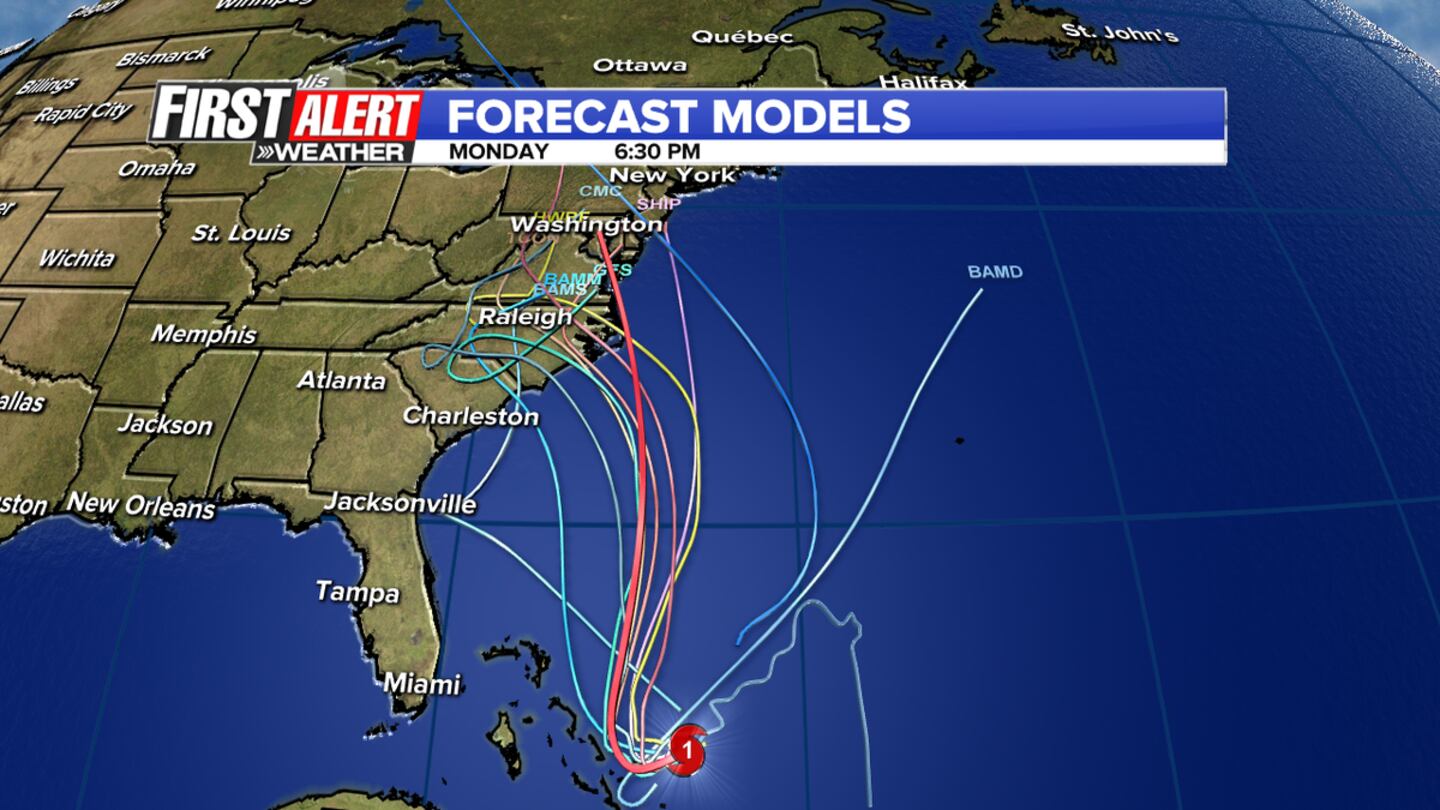
The forecast models were in disarray - this is from Wed. evening.... through Mon. evening. We know now that this simply wasn't even close (I believe the models were greatly confused by an incoming area of strong upper level low pressure & therefore the models developed too much low pressure near the east coast which the models mistook for "Joaquin". In the end, the 2 systems stayed apart -- by a long ways. Only the European global forecast model picked up on this possibility Wed./Thu. of last week, & it wasn't until Thu./Fri. that most of the rest of the models started to catch on.
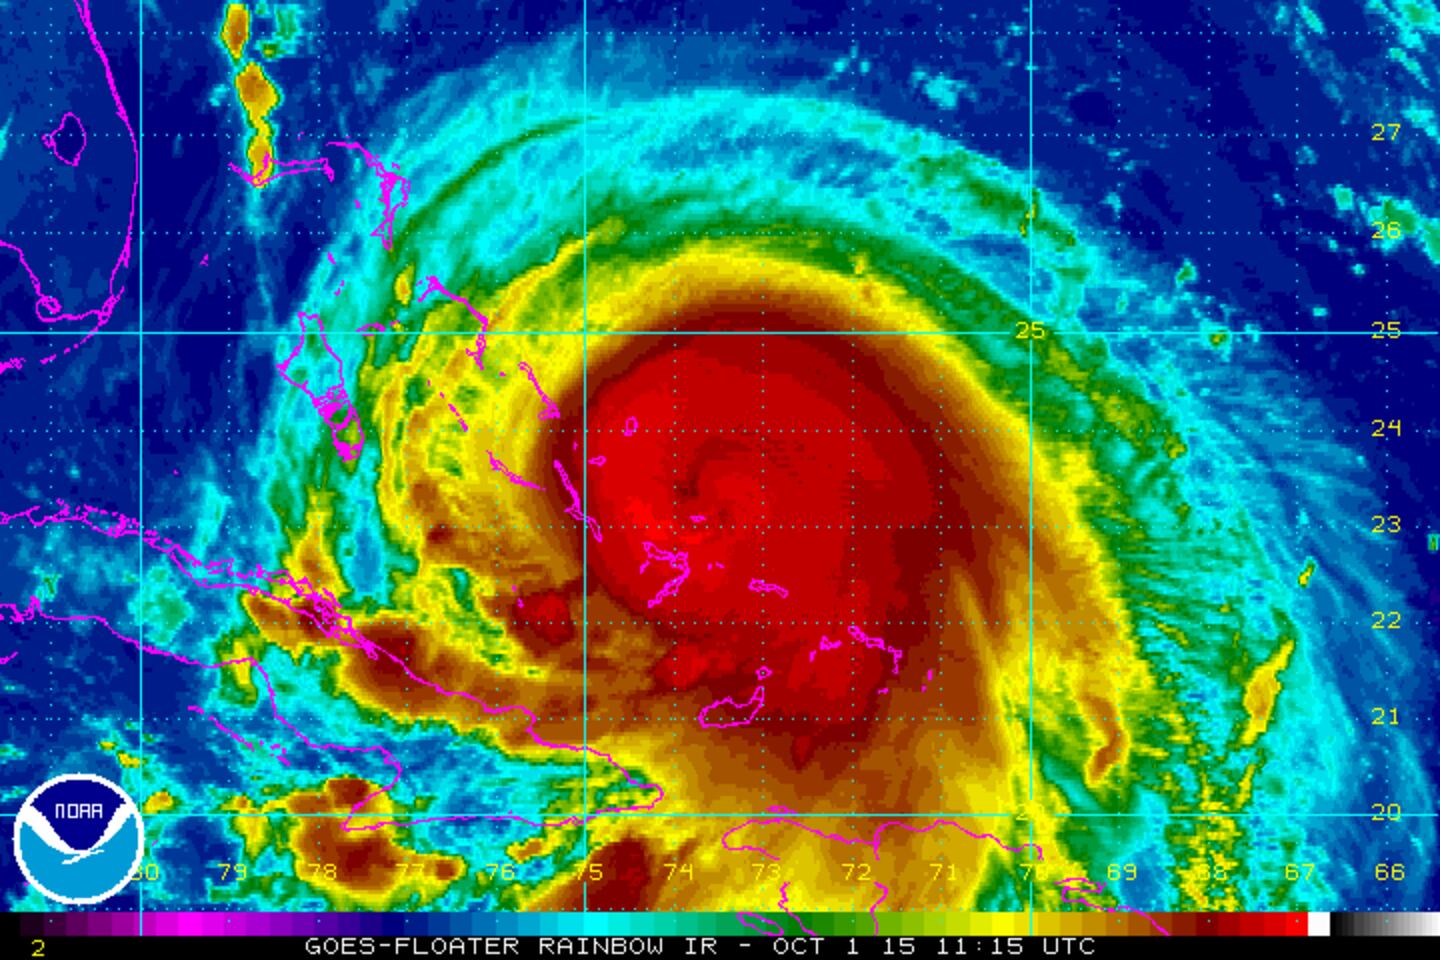
IR satellite imagery below at 7:15am, Thu. Oct. 1 - the approximate time of the last transmission from El Faro. Strong high end Cat. 3 "Joaquin's" eye was just north of Crooked Island which means the ship would have been very near the violent eyewall where winds were 120+ mph & seas were reported to be 40+ feet!
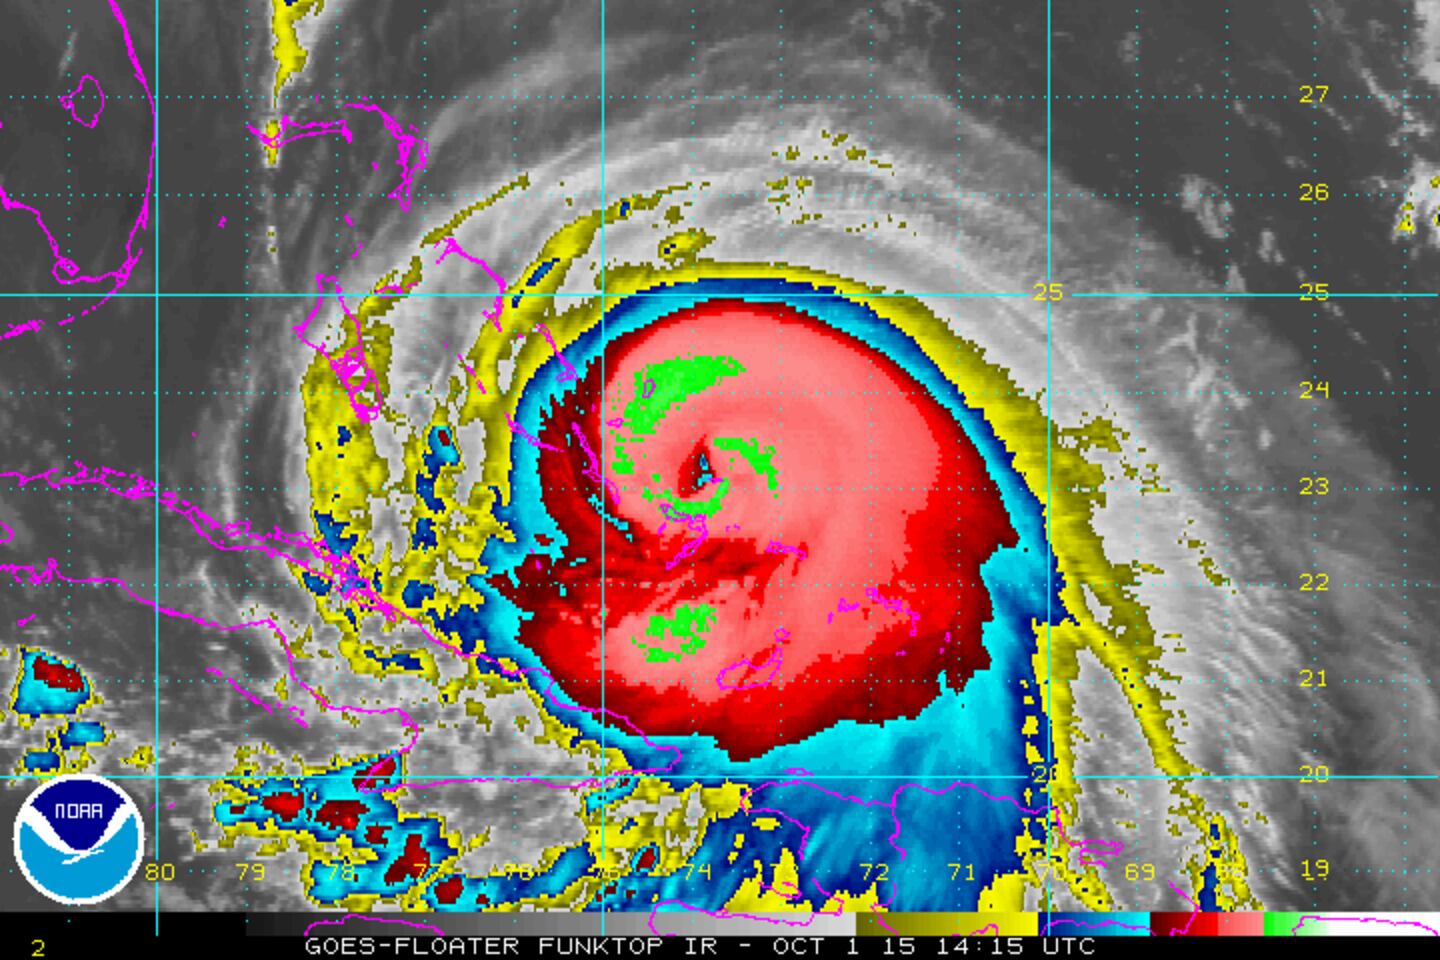
The IR image below is 24 hours later -- early Fri. (7:15am EDT) -- when search & rescue was underway for the El Faro. The eye of now Cat. 4 "Joaquin" is only about 40-50 miles northwest of Crooked Island & the search area was besieged by the more violent southeast quadrant of the powerful hurricane.
0
Thursday evening (Oct. 1) storm analysis -- immediate northwest of Crooked Island......
1
Cox Media Group


