
Jacksonville, Fl. — THE TROPICS:
***** ALWAYS CHECK & RE-CHECK THE LATEST FORECAST & UPDATES! ****
Tropics threats/impacts for Jacksonville/NE Florida/SE Georgia: None.
The Atlantic Basin Overview:
The Atlantic hurricane season is June 1st through Nov. 30th.
A Tropical Storm WARNING: The Gulf Coast from the Terrebonne/Lafourche Parish line, Louisiana to Sargent, Texas...
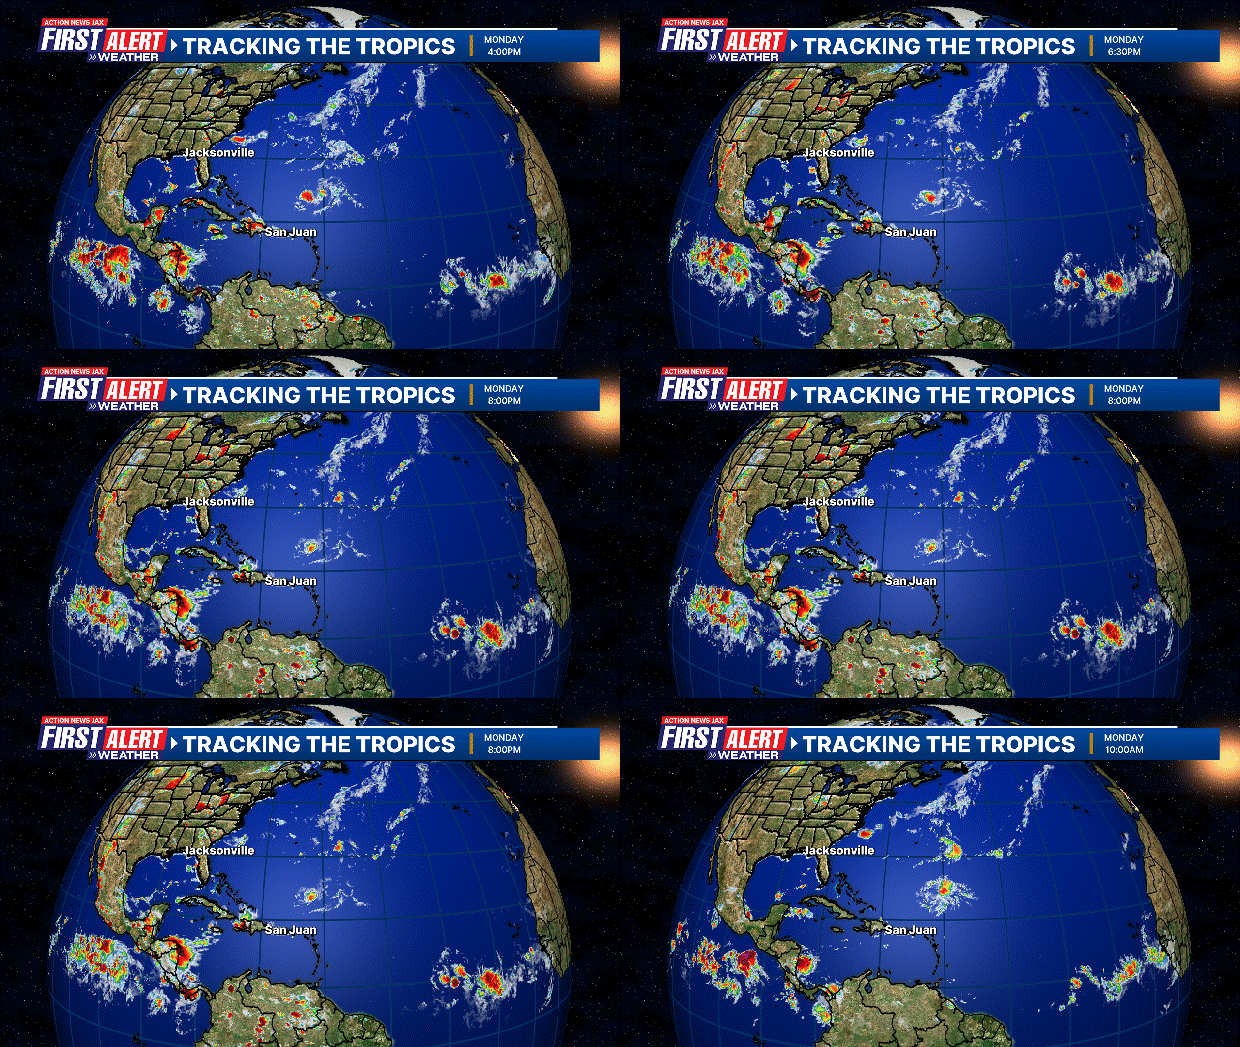
Early last Wed. the NHC outlined a yellow area (“low chance”) over the NE Gulf extending across Fl. & the SE U.S. coast which has since been shifted west & was colored in red (“high chance”) by early Sunday & upgraded to tropical depression #2 late Sunday morning. Then hurricane hunter aircraft determined t.d. #2 had strengthened into tropical storm Bertha Mon. evening. A very disorganized Bertha made landfall about 3pm EDT 40 miles east of New Orleans. All of the strong t’storms were far to the southwest of the swirling center. Estimated intensity was 45 mph but no sustained tropical storm force winds were being measured over land at the time of landfall.
Bertha’s development was a pretty classic “top/down” formation of a tropical cyclone as a surface low pressure finally emerged beneath a persistent upper low that was over the NE Gulf for several days. The poorly defined center may still jump around some as thunderstorm clusters wax & wane & may still try to reform to the south & southwest near the deepest convection from time to time. The favorable MJO phase + warm water temps + a decent amount of moisture (though is some dry air being absorbed from the NE over the continental U.S.) has been enough to continue to overcome persistent moderate to - at times - strong shear to allow for at least bursts of thunderstorms. Bertha is moving with the shear instead of against it which will probably not be as detrimental to the storm’s intensity as it might otherwise be.
The greatest threat looks to be some heavy rain & gusty winds (though not ‘damaging’) along the Gulf coast though the core of the heaviest rain will stay offshore given the lopsided orientation of the convection due to the shear until the center reaches the Texas coast then heavier rain will overspread Southeast Texas. A strengthening upper level high to the north will continue to solidly steer the system more west/southwest.
The persistent shear out of the northeast will maintain the core of heaviest squalls & strongest winds over the southern & southwest portion of the circulation. But daytime heating will help enhance loosely organized bands to the east & north of the center in the afternoon hours before weakening during the overnight hours. What’s left of Bertha should dissipate over Texas.




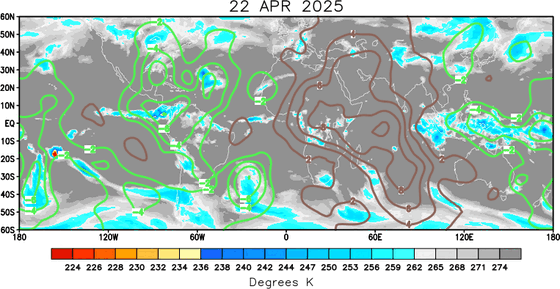
‘Velocity potential anomalies’ below. “Rising” air (green lines) equates with an uptick in overall convection. With rising air, conditions are generally more favorable for tropical development. Where there are brown lines, the air is generally sinking & is often less conducive to tropical cyclones (though not impossible to have development).
The “Buresh Bottom Line”: Always be prepared!.....First Alert Hurricane Preparation Guide... City of Jacksonville Preparedness Guide... Georgia Hurricane Guide.
STAY INFORMED: Get the * FREE * First Alert Weather app
FREE NEWS UPDATES, ALERTS: Action News Jax app for Apple | For Android
WATCH “Preparing for the Storm”
READ the First Alert Hurricane Center “Preparation Guide”
LISTEN “First Alert Weather: Preparing for the Storm”
Federal Alliance for Safe Homes (FLASH) * here *.
REMEMBER WHEN A TROPICAL STORM OR HURRICANE IS APPROACHING: Taping windows is *not* recommended & will not keep glass from breaking. Instead close curtains & blinds.
Realize the forecast cone (”cone of uncertainty”) is the average forecast error over a given time - out to 6 days - & *does not* indicate the width of the storm &/or where damage might occur.
The map below shows the *average* time for a tropical wave coming off Africa to travel west & northwest. Only about 1 in 5 tropical waves - on average - become a tropical cyclone of some sort (depression/storm/hurricane):



Water vapor loop (dark blue/yellow is dry mid & upper level air):

July Atlantic tropical cyclone origins:

Averages below based on climatology for the Atlantic Basin for July:

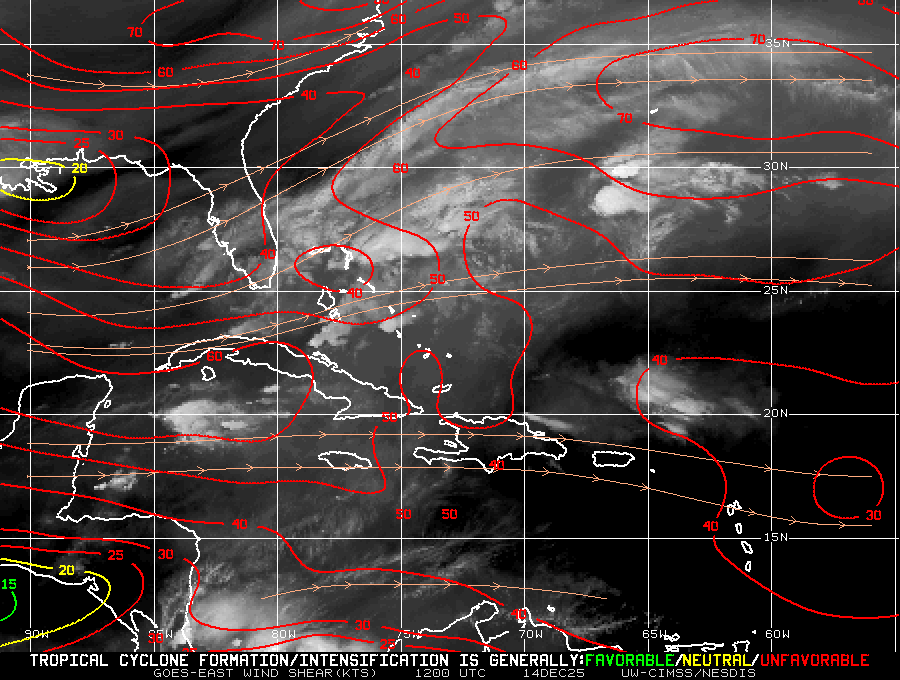
Wind shear (red - strong shear; green - low shear). Shear is typically strong to start the hurricane season:

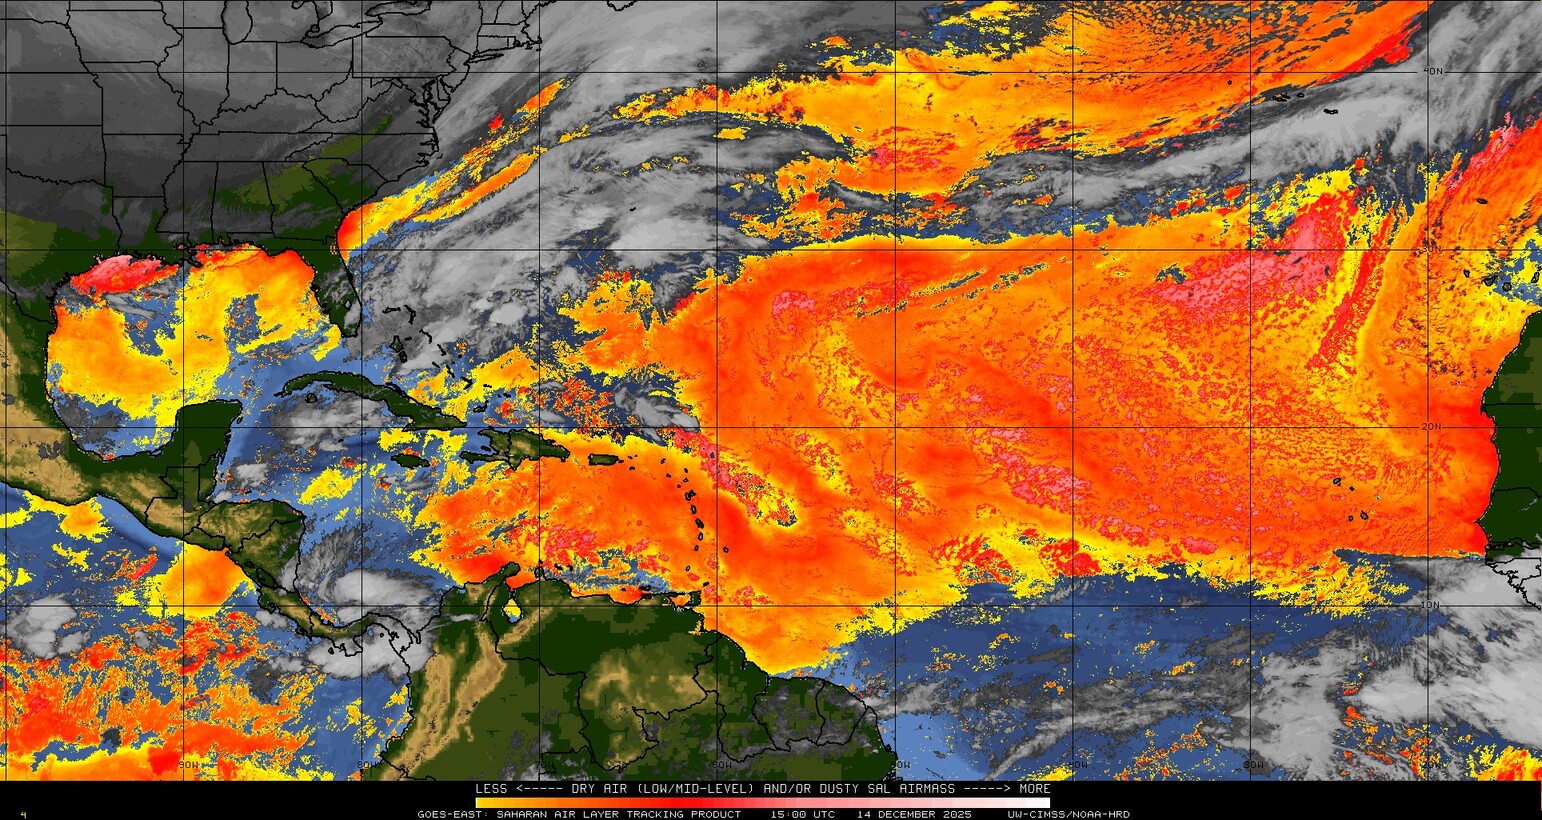
Saharan dust spreads west each year from Africa driven by the prevailing winds (from east to west over the Atlantic). Dry air = yellow/orange/red/pink. Widespread dust is indicative of dry air that *can* interfere with the development of tropical cyclones. However, sometimes “wanna’ be” waves will just wait until they get to the other side of - or away from - the dust plume then try to develop if other conditions are favorable (we saw this with Beryl & Debby last year). It’s my personal opinion that there is way too much “hoopla” about the presence of Saharan dust & how it relates to tropical cyclones. In any case, the peak of Saharan dust typically is in June & July, & we are indeed seeing a large “blobs” of Saharan dust over the Central & Eastern Atlantic that’s thinning with westward extent but enough of it to make for hazy skies across the Caribbean & - at times - across parts of Florida.
2026 names..... “Cristobal” is the next name on the Atlantic list (names are picked at random by the World Meteorological Organization... repeat every 6 years). Historic storms are retired [Florence & Michael in ’18... Dorian in ’19 (the last time this year’s list was used) ... Laura, Eta & Iota in ‘20 ... Ida in ‘21 ... Fiona & Ian in ‘22... no names were retired in ‘23 for the first time since 2014... Beryl, Helene & Milton in 2024 & Melissa in 2025). The WMO decided - beginning in 2021 - that the Greek alphabet will be no longer used & instead there will be a supplemental list of names if the first list is exhausted (has only happened three times - 2005, 2020 & 2021). The naming of tropical cyclones began on a consistent basis in 1953. More on the history of naming tropical cyclones * here *.

Hurricane season climatology:

East Atlantic:


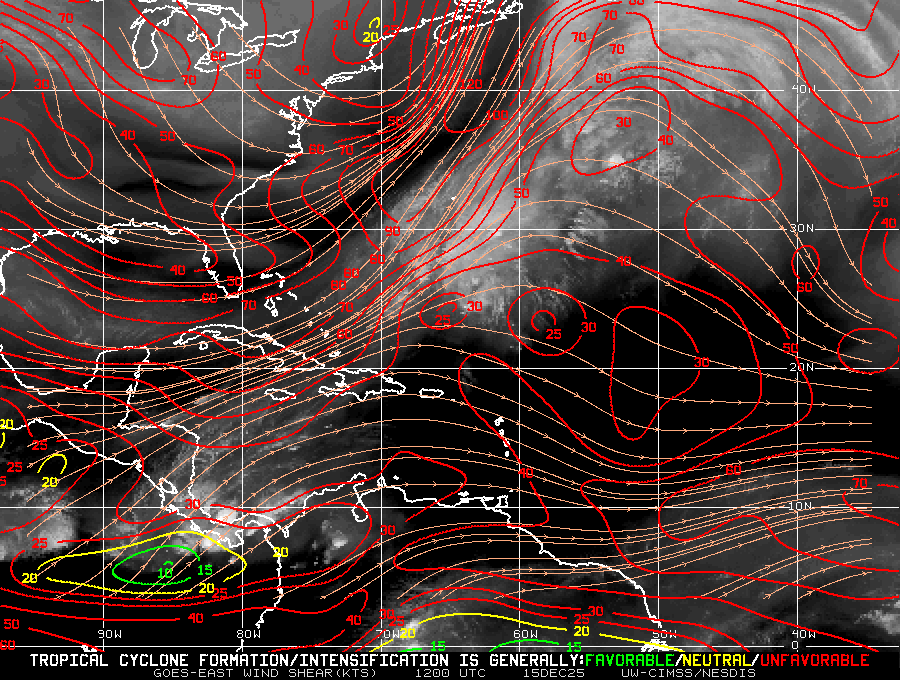
Mid & upper level wind shear (enemy of tropical cyclones) analysis (CIMMS). The red lines indicate strong shear - typically the “enemy” of tropical systems:
Water vapor imagery (dark blue indicates dry air):

Deep oceanic heat content over the Gulf, Caribbean & tropical Atlantic. Brighter colors = warmer temps.:

Sea surface temps.:

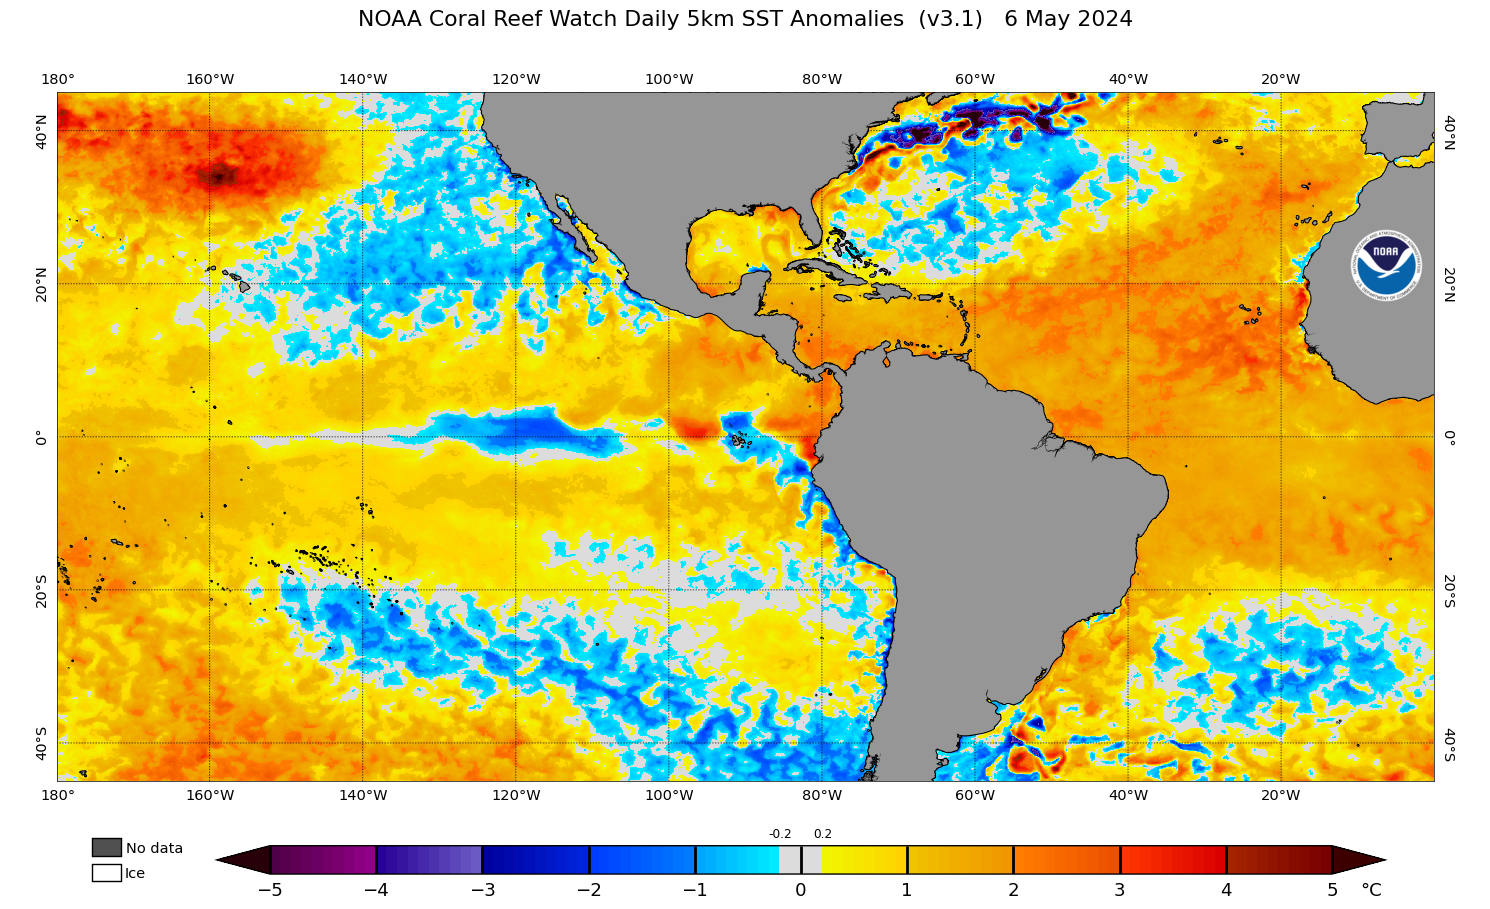
Sea surface temp. anomalies:
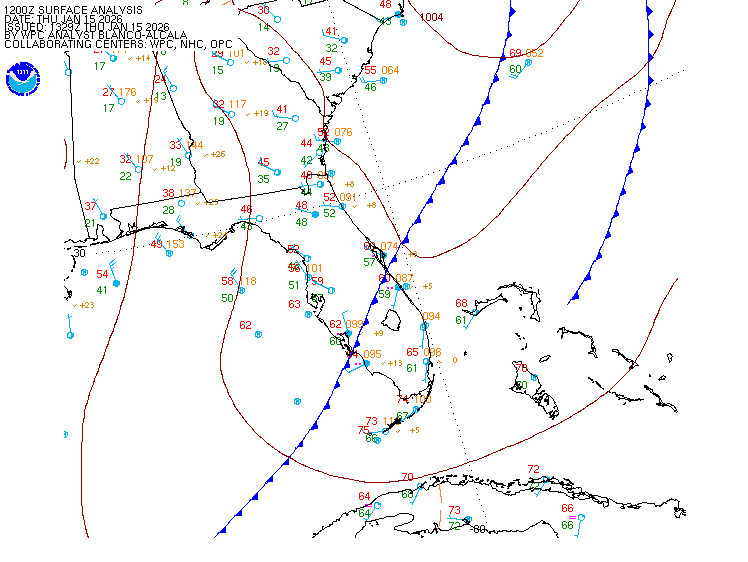
SE U.S. surface map:
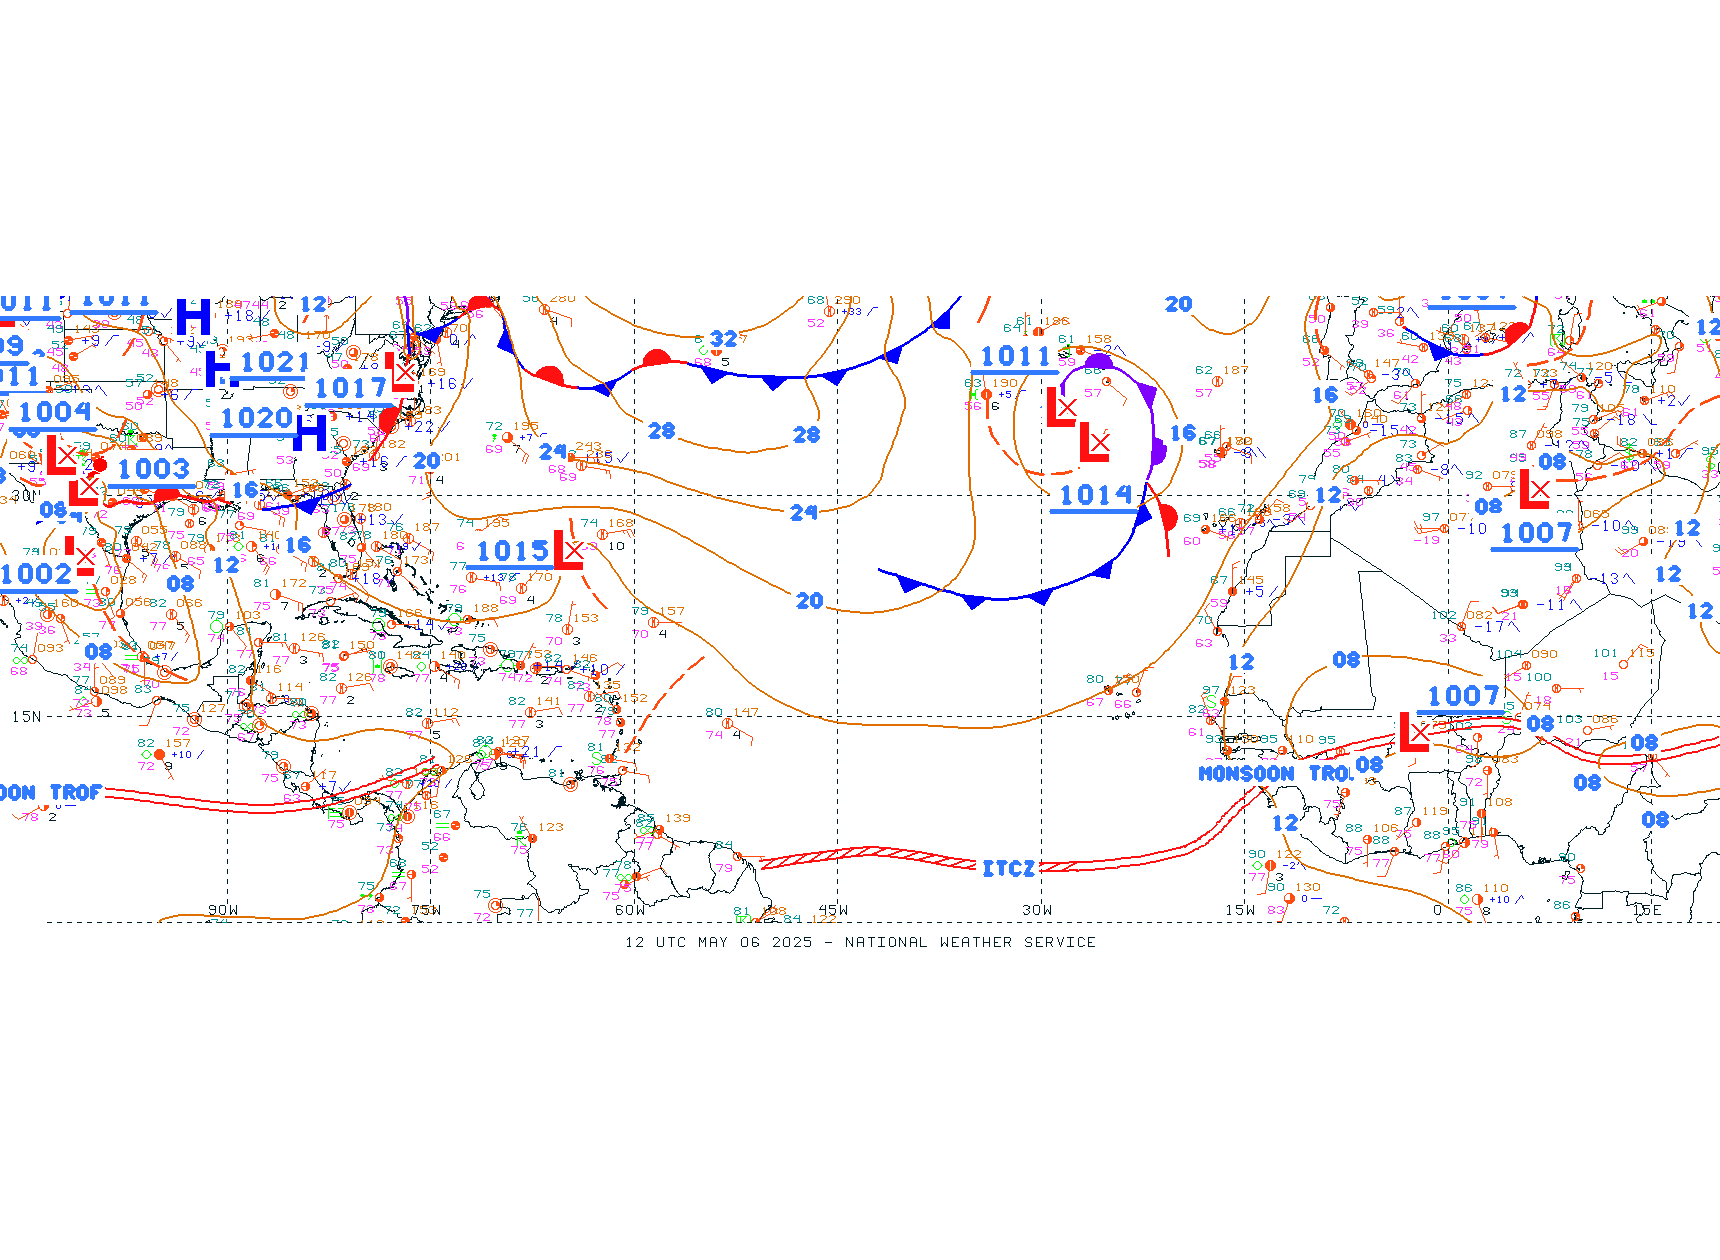
Surface analysis centered on the tropical Atlantic:
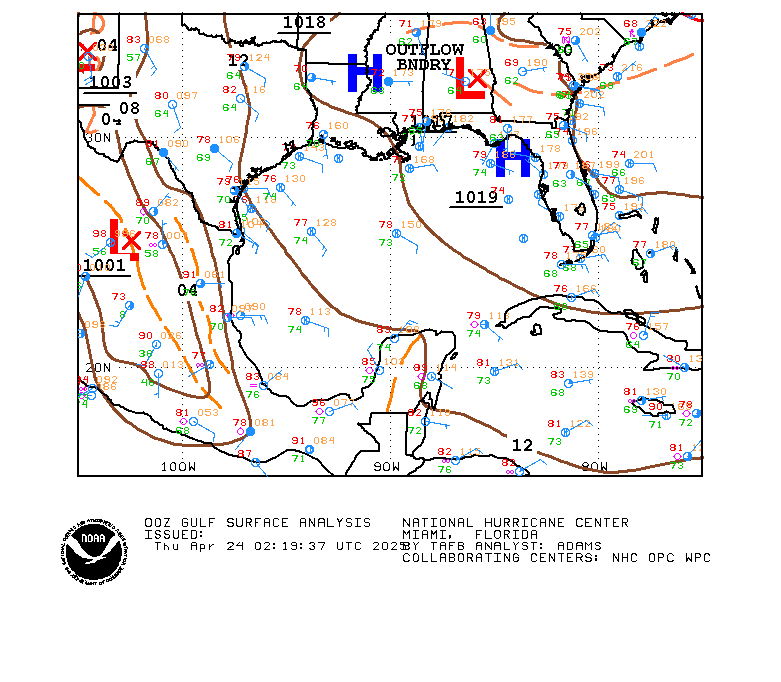
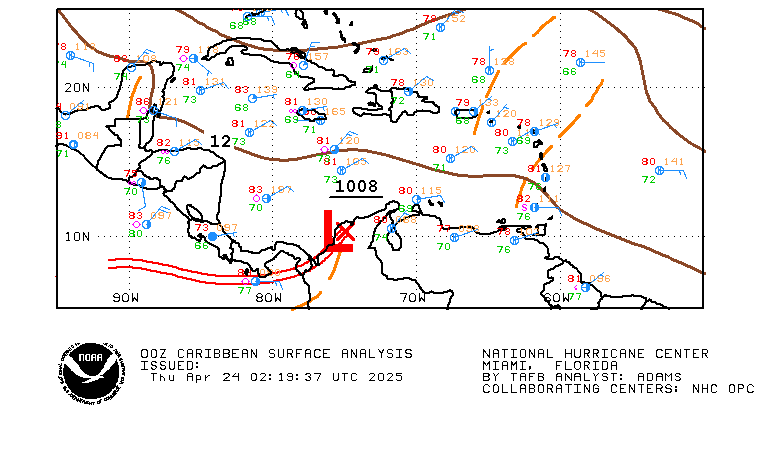
Surface analysis of the Gulf:
Caribbean:
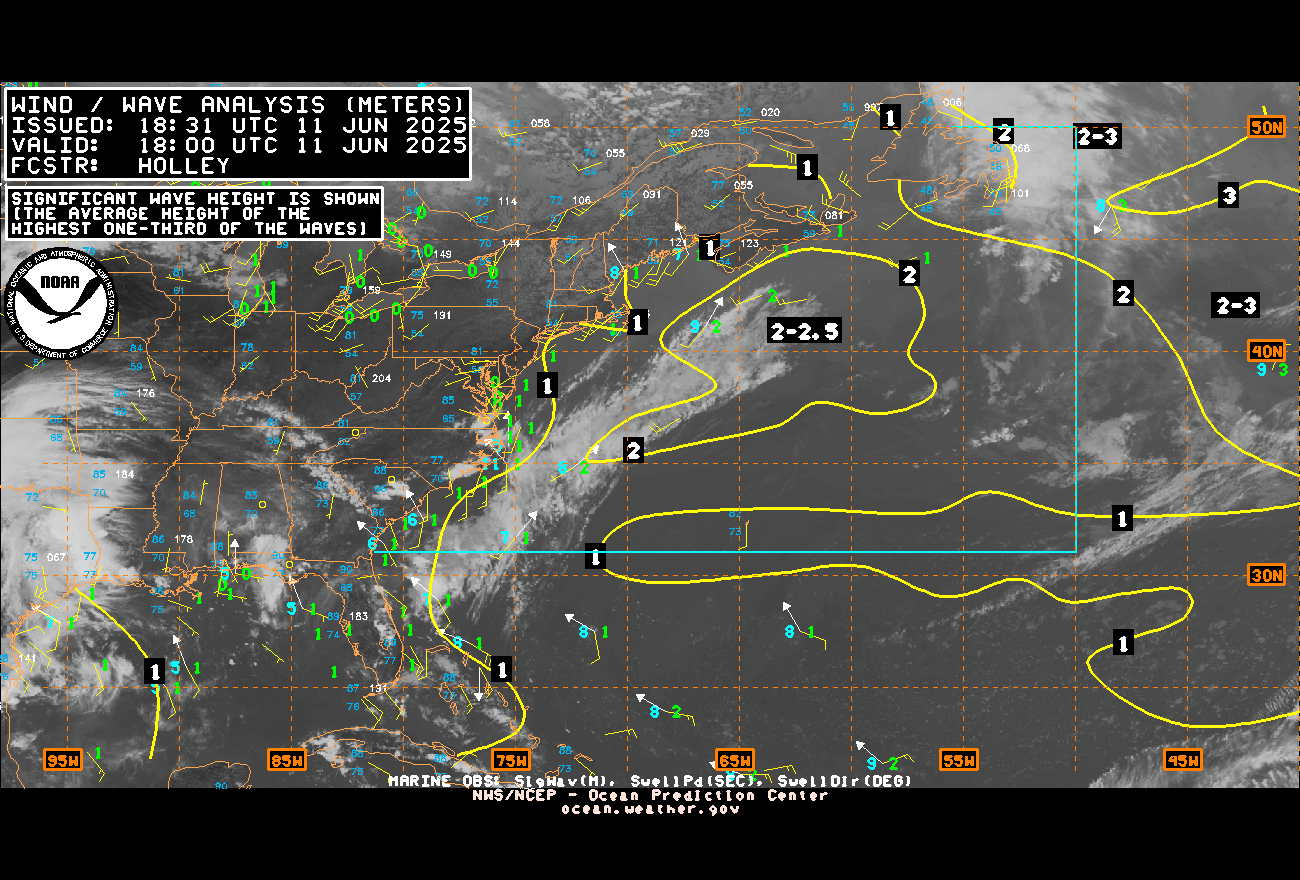
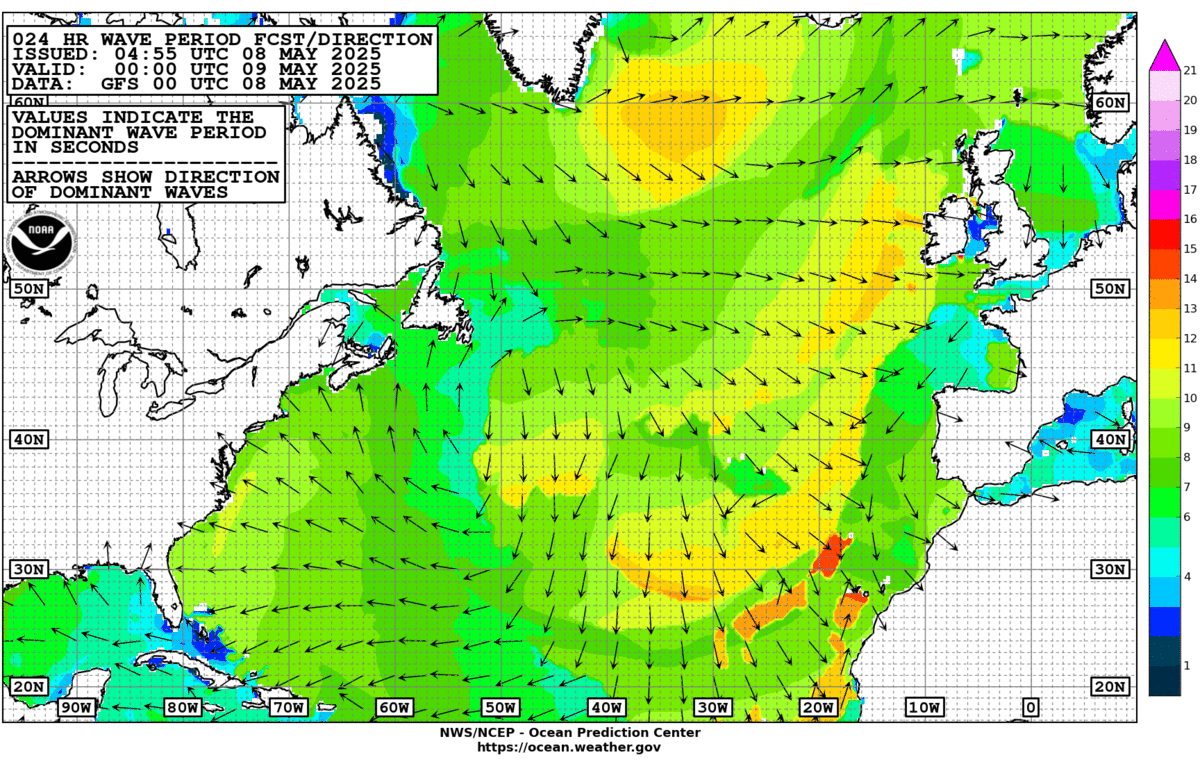
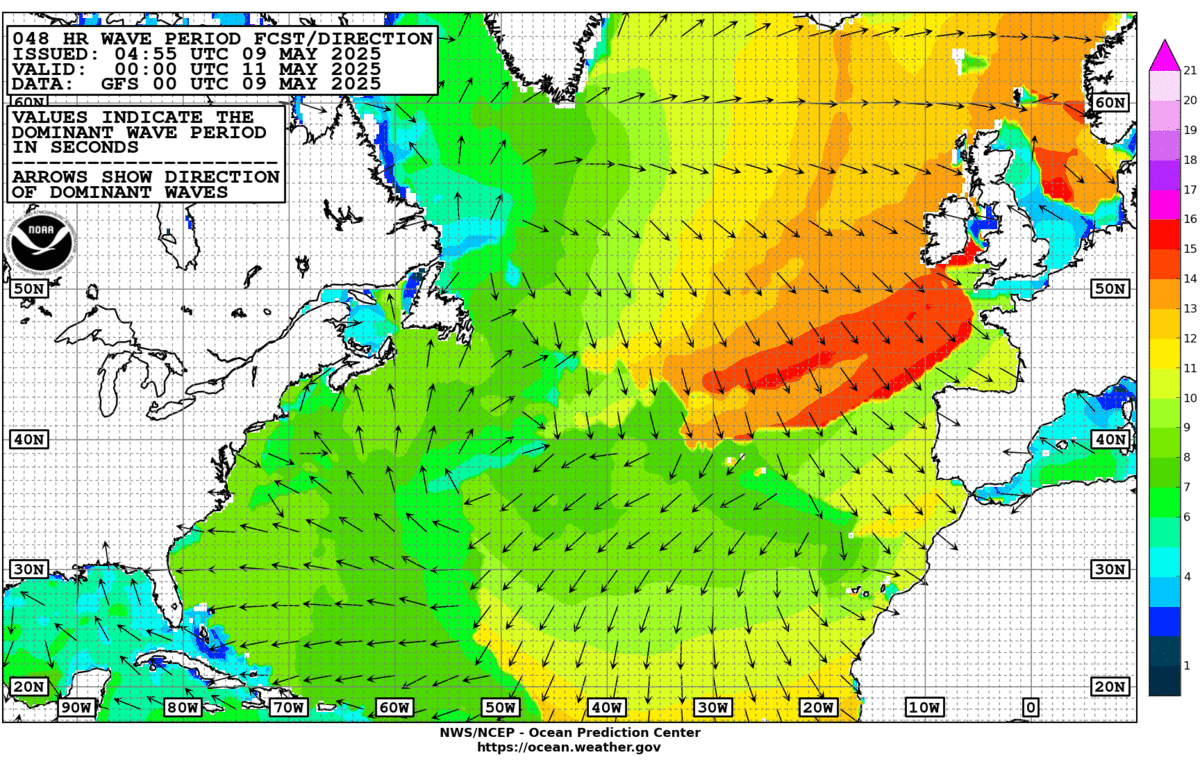
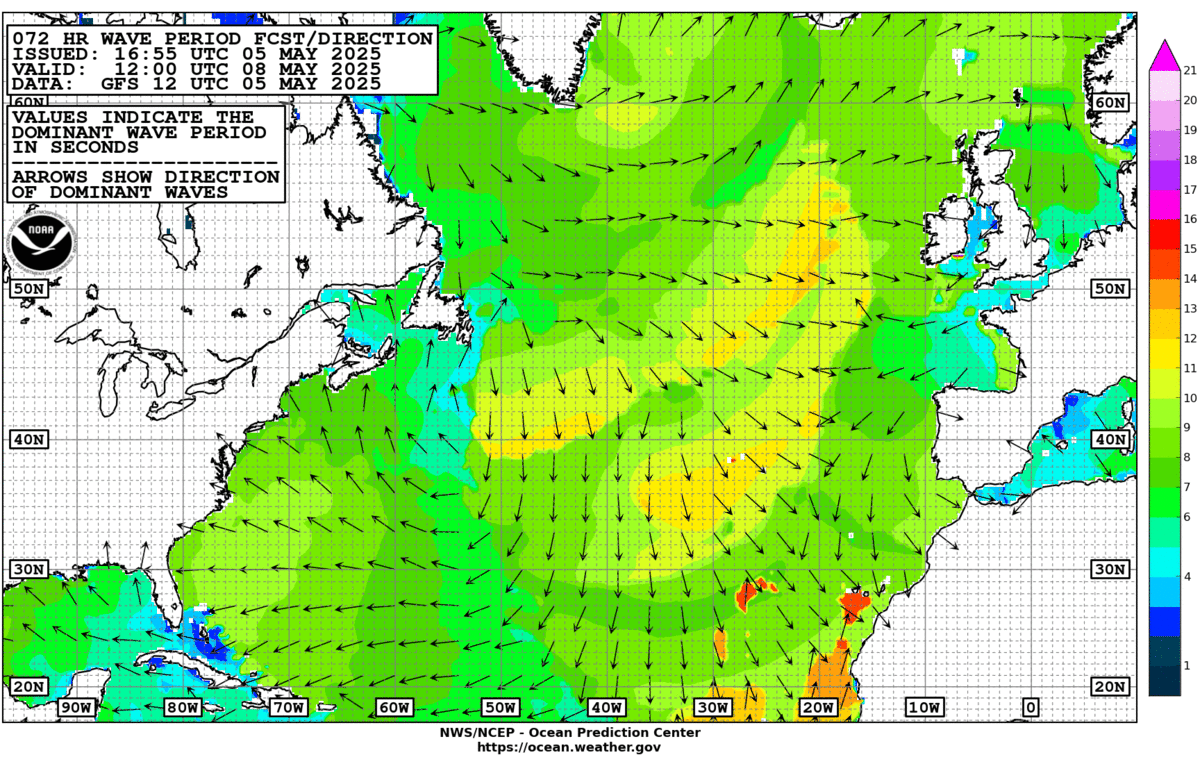
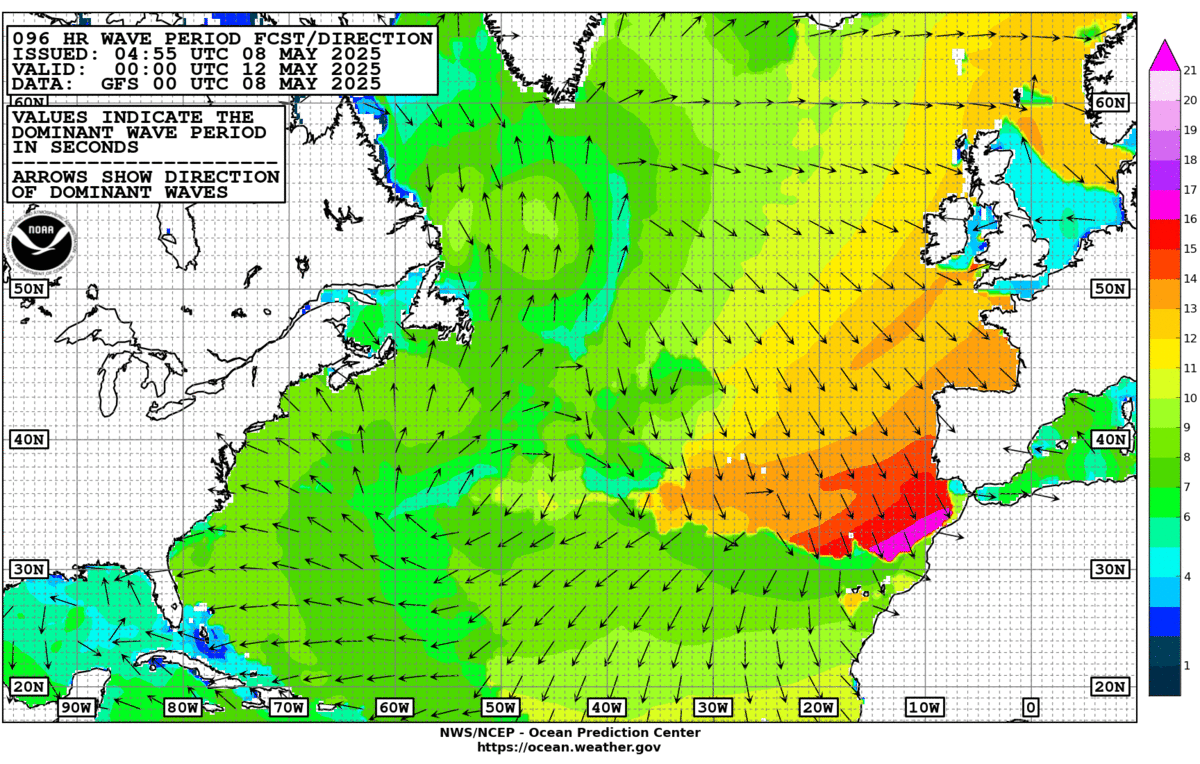
Atlantic Basin wave period forecast for 24, 48, 72 & 96 hours respectively:

East & Central Pacific:
This basin will most likely be the generally more active area in ‘26 due to the anticipated El Nino.
“Fausto” may near Hawaii next week:



Central Pacific:
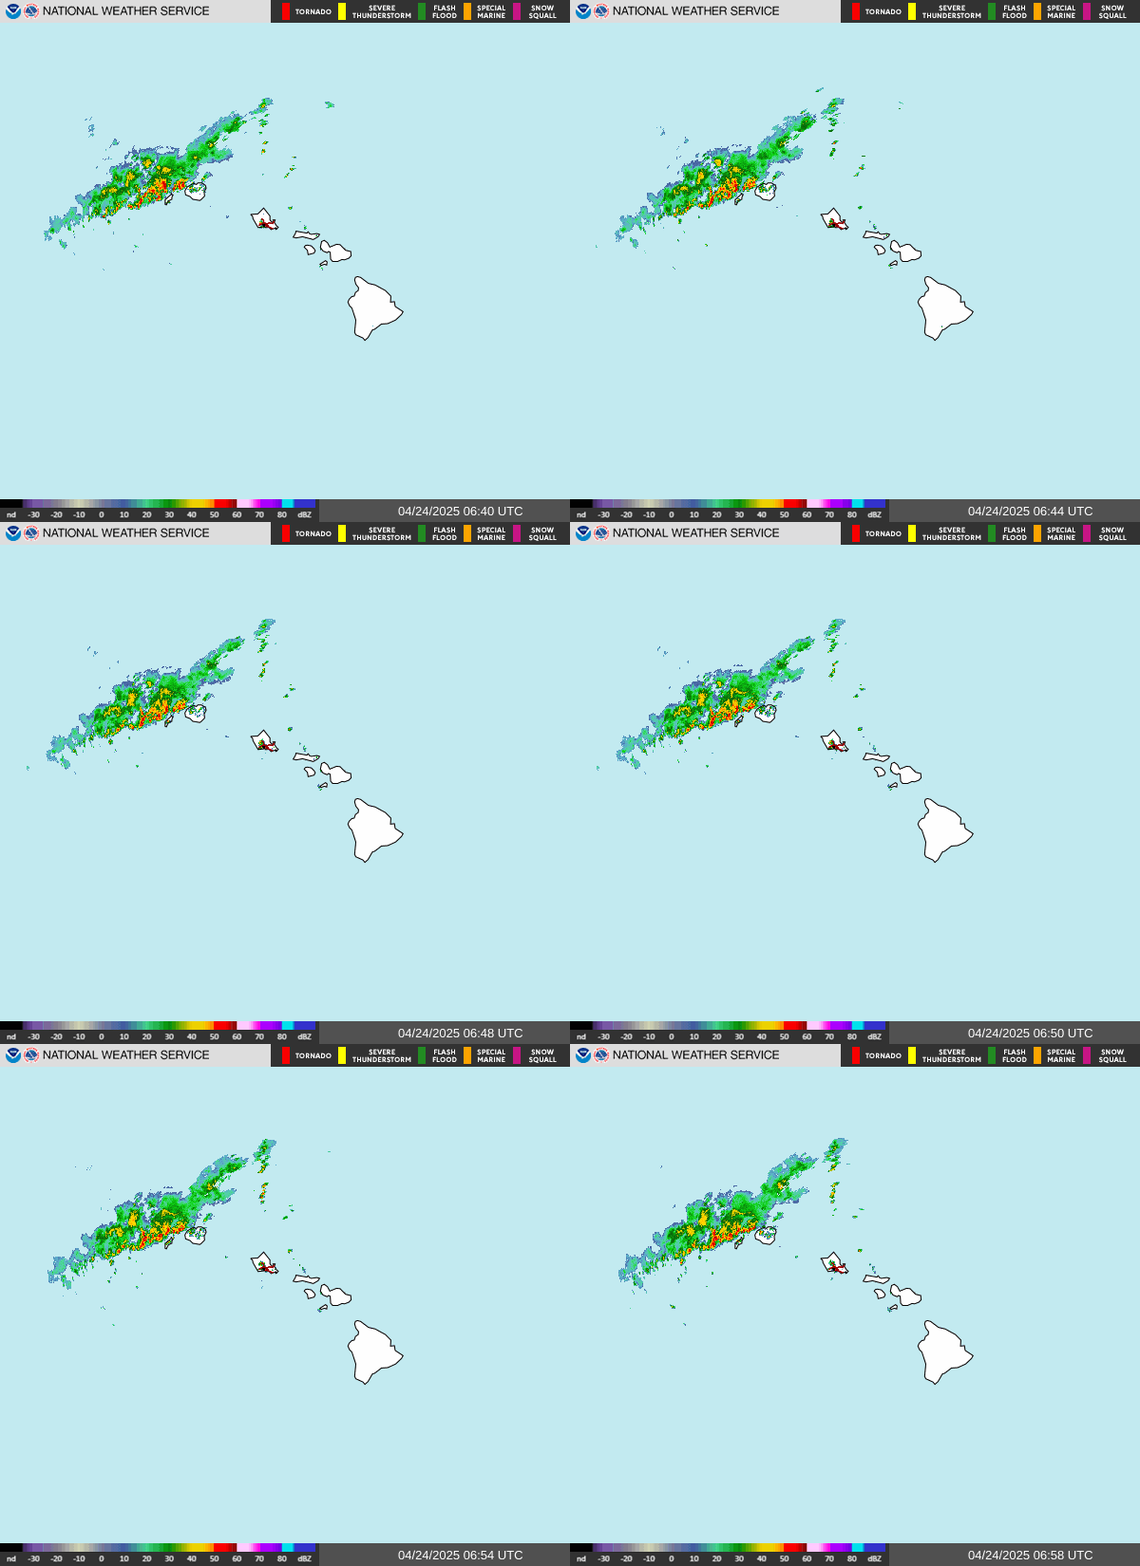
Hawaii satellite imagery:

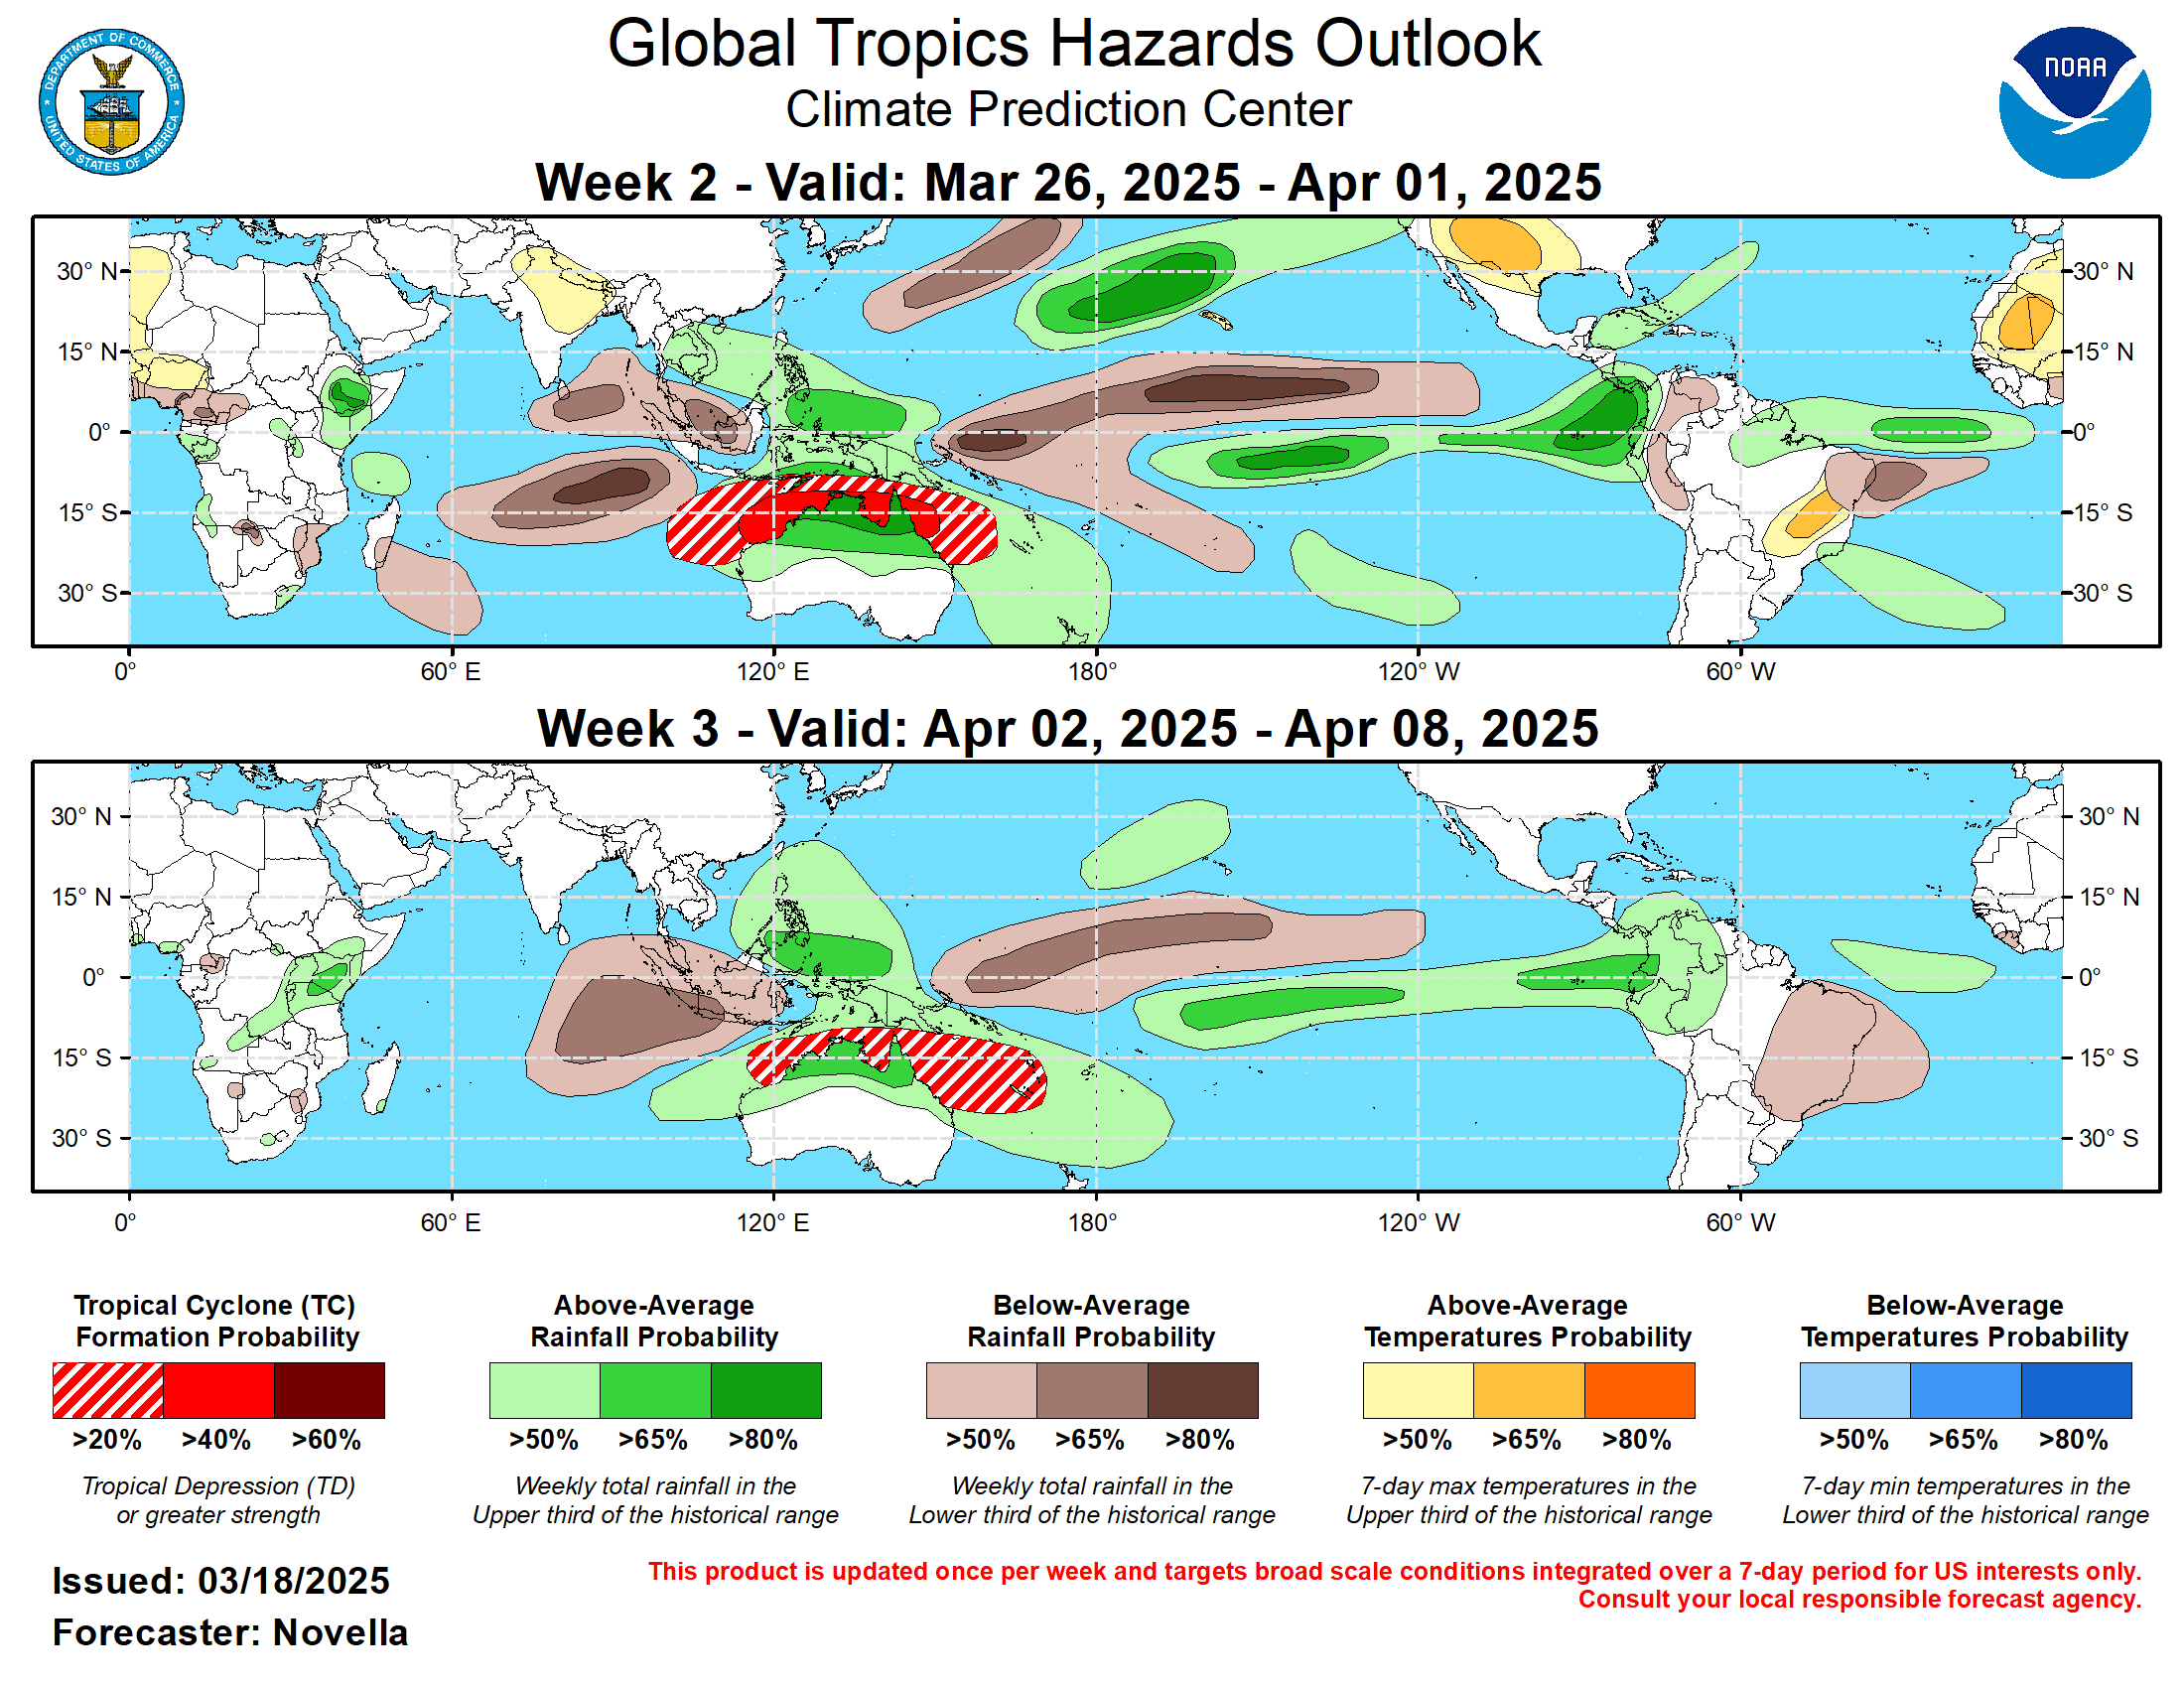
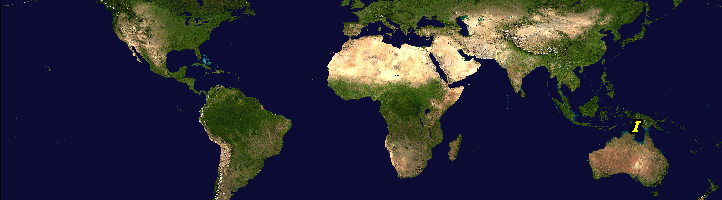
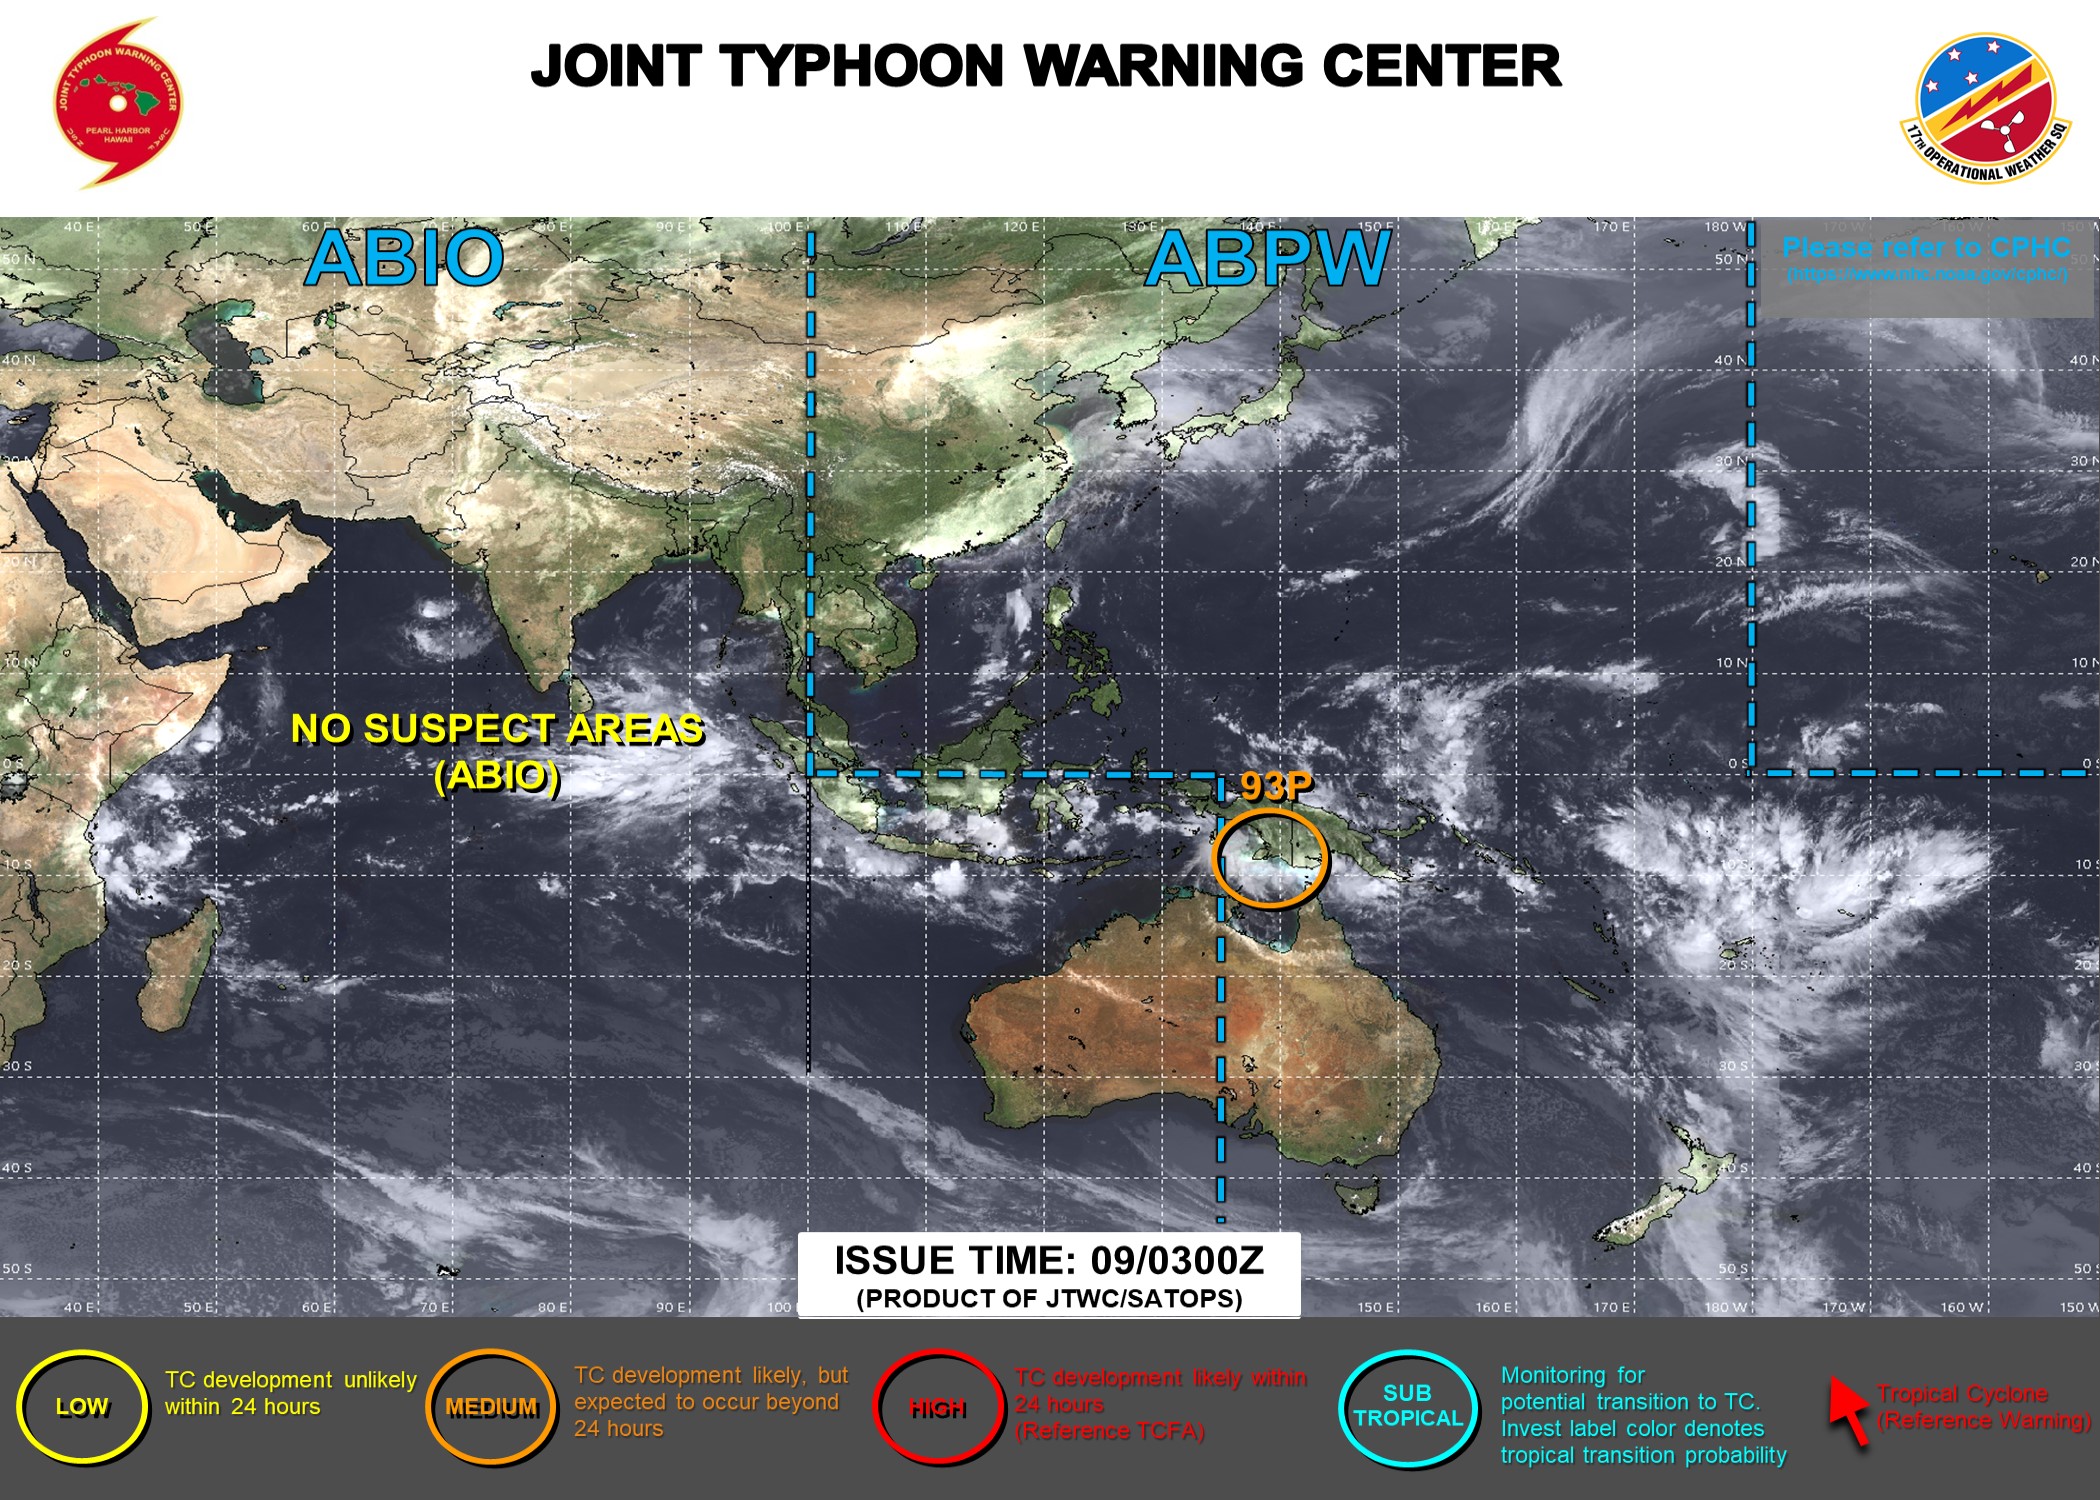
Global tropical activity:
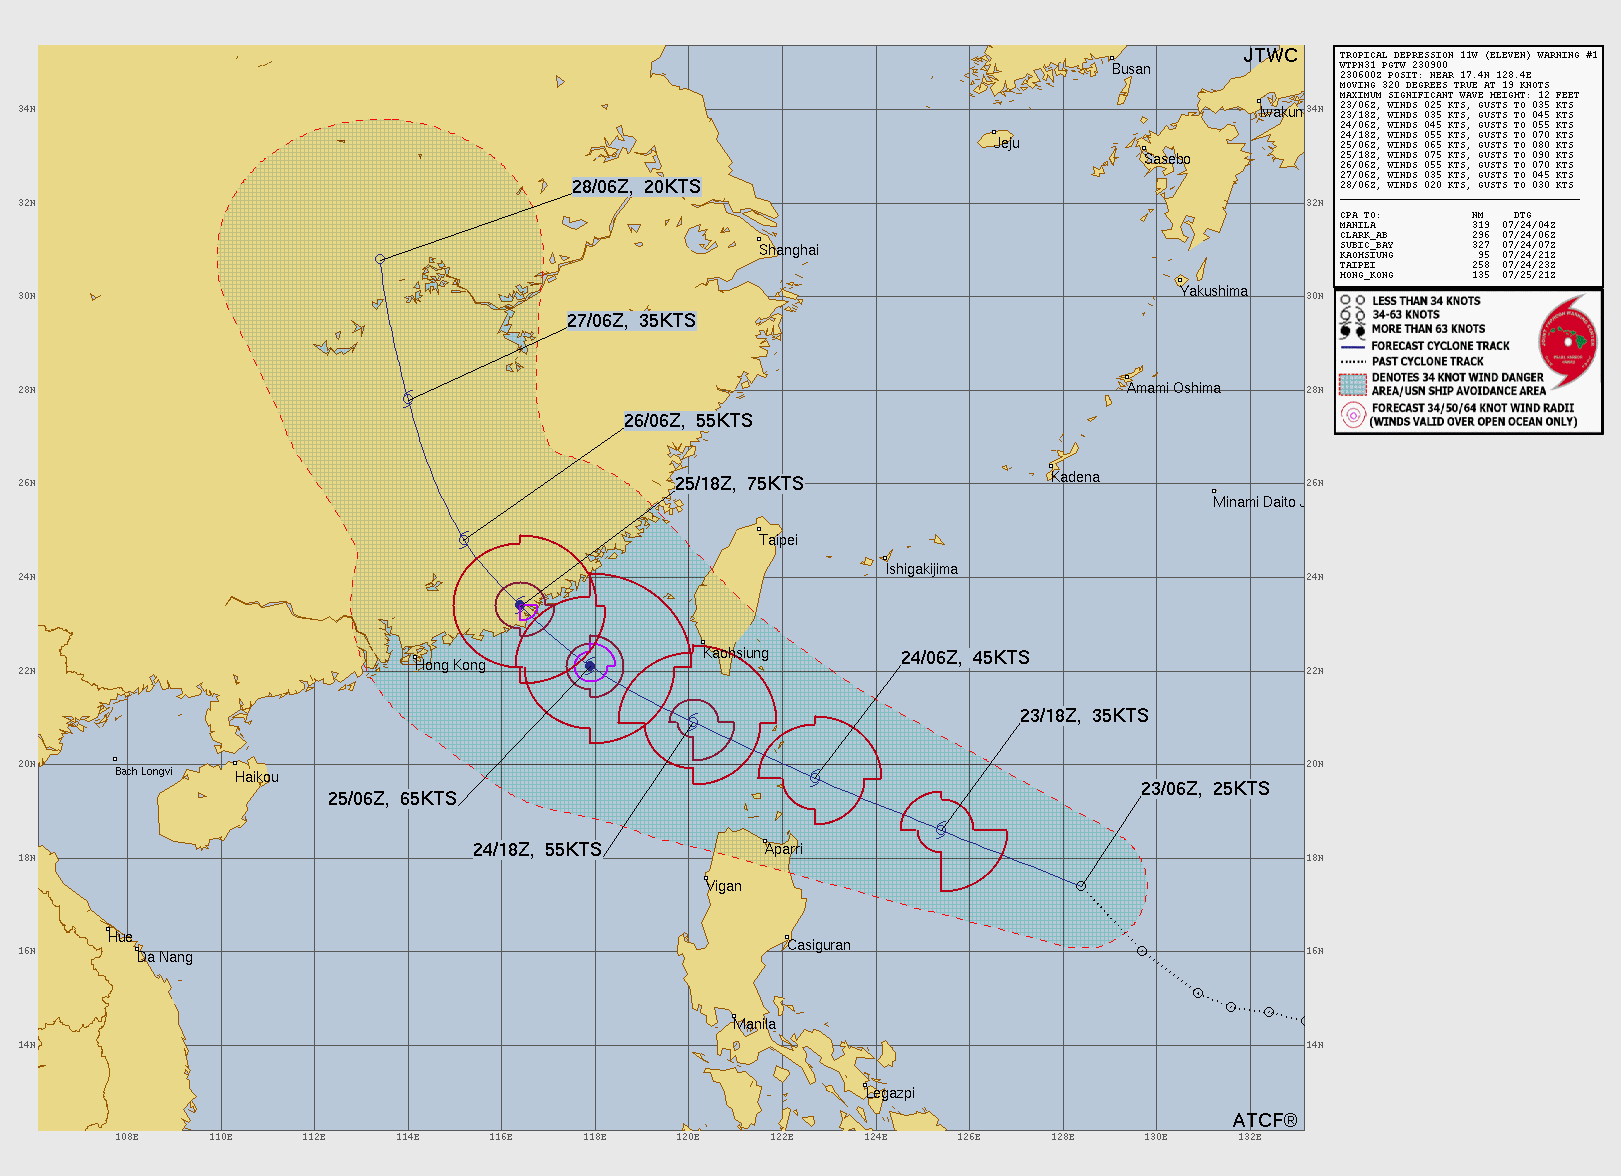
West Pacific:


Cox Media Group


